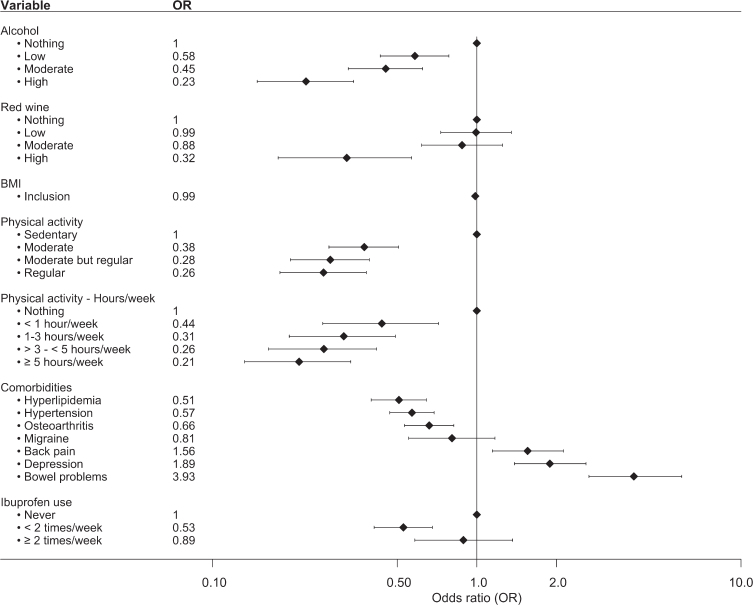
Fig. 2.
Forest plot over the associations between various variables and PD. Analyzed variables were obtained from questions regarding exposure/use within the past year prior to study inclusion. The plot shows OR and 95% CI adjusted by age at inclusion and sex. Number of individuals in each analysis is found in Supplementary Table 2.

