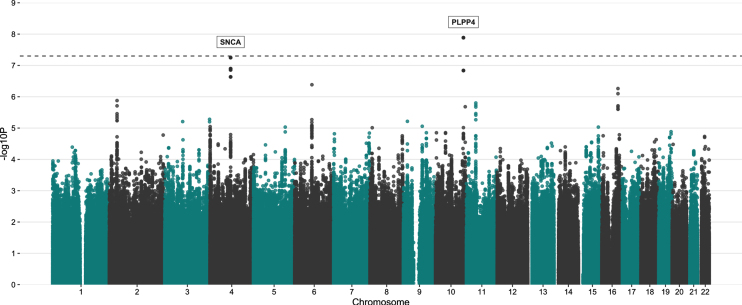
Fig. 3.
Manhattan plot showing the result from PD GWA analysis. A total of 5,445,841 SNPs (MAF > 5%) were tested for 929 PD patients vs. 935 controls. The y-axis represents the negative log (two-sided p-values) for association of variants with PD and the x-axis represent the genomic position on genome build GRCh37. The horizontal dashed line indicates the genome-wide significance level (p = 5E-08).

