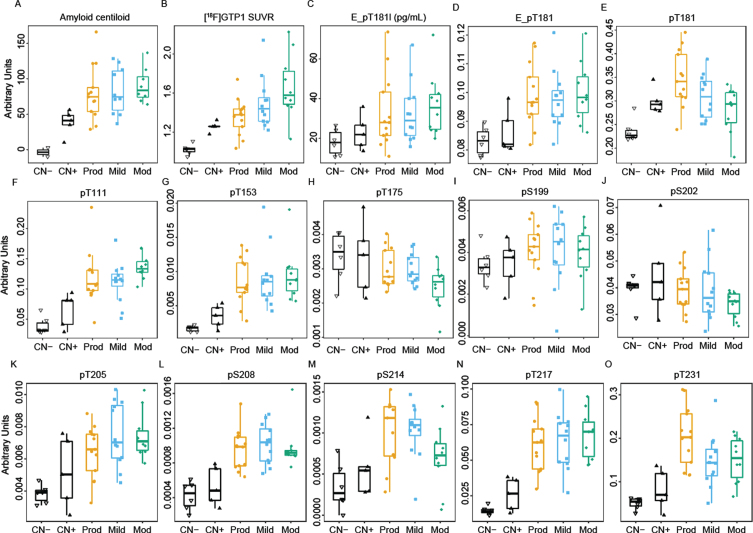
Fig. 1.
Cross-sectional boxplots from Cohort A comparing brain amyloid deposition (A) measured by FBP tracer (Amyloid centiloid), (B) [18F]GTP1 SUVR measuring brain tau aggregates, (C) Elecsys immunoassay measures of pTau181 level (E_pT181l), and (D) ratio of pTau181/tTau (E_pT181), (E) ratio of pTau181/uTau by MS, and (F–O) ratio of other phosphorylated residues by MS. CN-, cognitively normal, amyloid-low control; CN+, amyloid-high control; prod, prodromal; mod, moderate.

