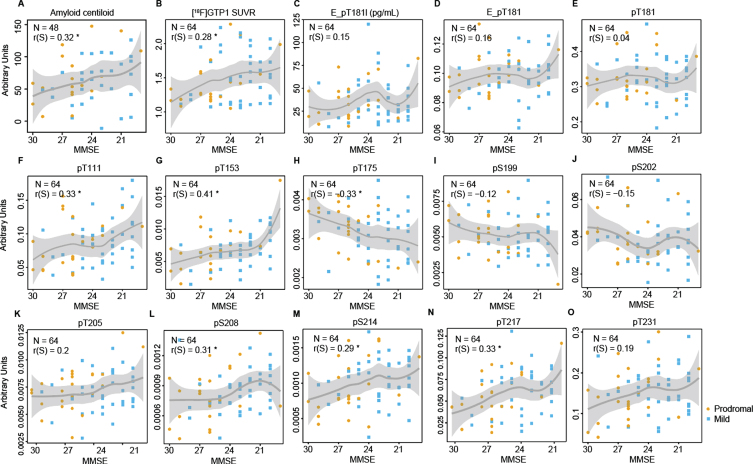
Fig. 2.
Scatter plot from Cohort B comparing MMSE and brain amyloid deposition measured by (A) florbetaben or florbetapir tracer (Amyloid centiloid), (B) [18F]GTP1 SUVR measuring brain tau aggregates, (C) Elecsys immunoassay measures of pTau181 level (E_pT181l), and (D) ratio of pTau181/tTau (E_pT181), (E) ratio of pTau181/uTau by MS, and (F–O) on other phosphorylated residues by MS. The polynomial curve and the shaded area show the locally weighted average (tricube weight function with quadratic local regressions) phosphorylation and its 95% confidence interval. orange, prodromal; blue, mild; PET, positron emission tomography; SUVR, standardized uptake value ratio; MMSE, Mini-Mental State Examination.

