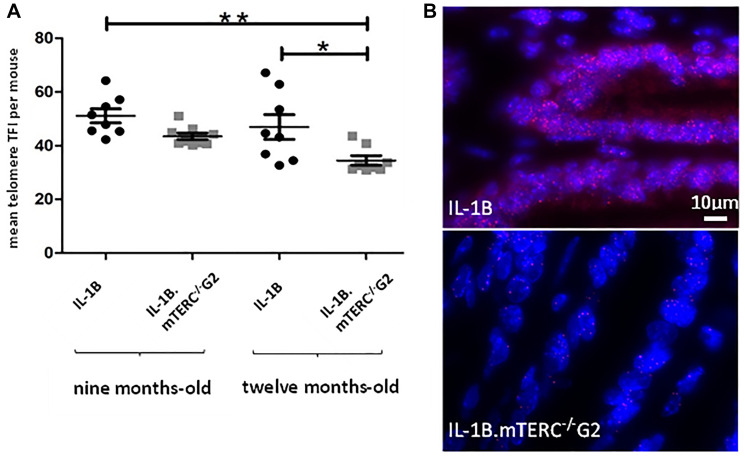
Figure 2. Murine telomere analysis.
Figure (A) depicts telomere length as mean TFI of SCJ-cells per mouse of both genotypes at both time points. Means differed significantly between 9-month-old L2-IL-1B mice and 12-month-old L2-IL-1B.mTERC−/− G2 mice (p < 0.01, one-way-ANOVA, Tukey’s post-hoc test). Furthermore means of 9-month-old L2-IL-1B.mTERC−/− G2 mice and 12-month-old L2-IL-1B.mTERC−/− G2 mice differed significantly (p < 0.05, one-way ANOVA, Tukey’s post-hoc test). Graphic (B) shows exemplary qFISH-images of both genotypes. Red spots show Cy3-labeled telomeres; DNA is stained blue by DAPI.

