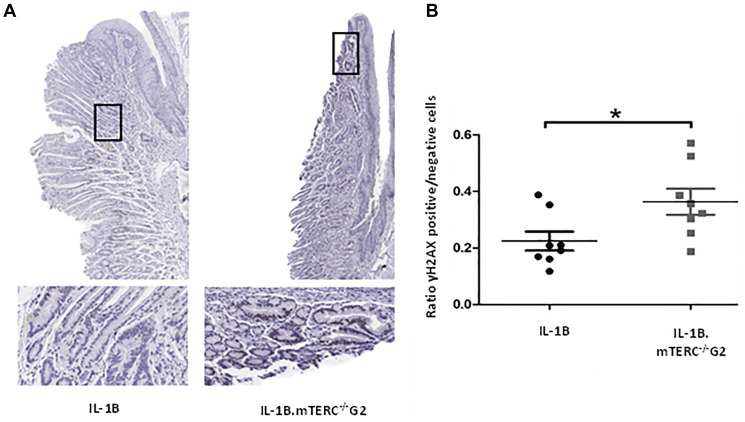
Figure 4. DNA-damage analysis.
Graphic (A) shows representative scans of SCJ-tissues of 12-month-old L2-IL-1B and L2-IL-1B.mTERC−/− G2 mice stained for yH2AX with framed regions magnified in the images below. Dark brown/black (DAB) stained nuclei indicate antibody-binding at γH2AX loci. Graph (B) displays ratios of γH2AX positive to γH2AX negative cells at the SCJ regions of 12 months-old mice of both genotypes. Means and standard deviation are indicated by horizontal bars. The asterisk marks a significant difference. 12 month old L2-IL-1B.mTERC−/− G2 show a significant higher rate of γH2AX positive cells, compared to 12-month-old L2-IL-1B mice (p < 0.03, unpaired t-test).

