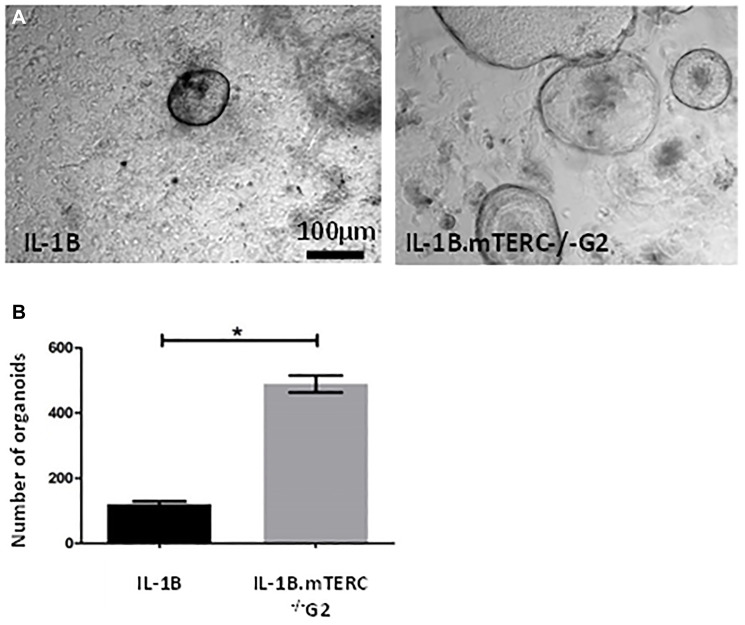
Figure 5. In-vitro analysis.
(A) shows exemplary light microscopic photo of organoids cultivated from SCJ cell isolations. Gross visible comparison yielded no differences in organoid morphology (size, organoid wall thickness). Graph (B) depicts the number of organoids 48 h after the 3rd passage for both genotypes after correction for organoid number at the beginning of the 3rd passage. Means and standard error of the means are indicated. The L2-IL-1B.mTERC−/− G2 group presented with a significantly higher number of organoids (p < 0.01, unpaired t-test).

