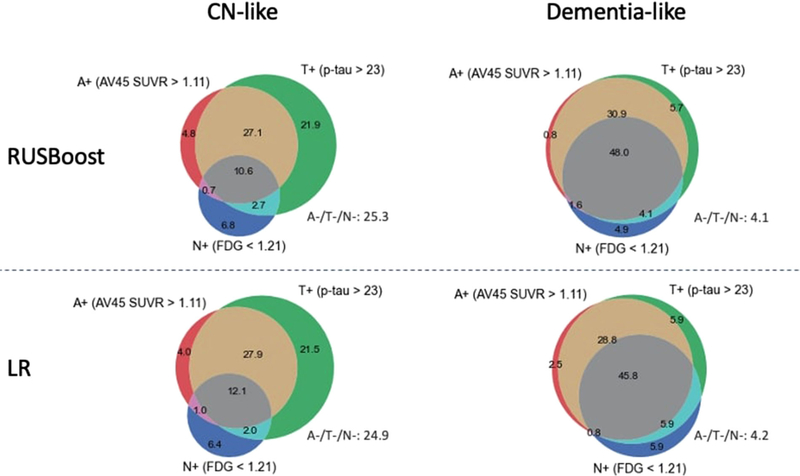
FIGURE 2.
ATN biomarker profile of aMCI participants in different classification groups. Classification model is developed by applying RUSBoost ML models (top) or logistic regression (LR) models (bottom) to demographics, APOE ε4 status, and neuropsychological tests. Numbers represent the percentage in a particular color. A, amyloid; aMCI, amnestic mild cognitive impairment; APOE, apolipoprotein E; CN, cognitively normal; FDG, 18F-fluorodeoxyglucose; ML, machine learning; N, neurodegeneration; SUVR, standardized uptake value ratio; T, tau

