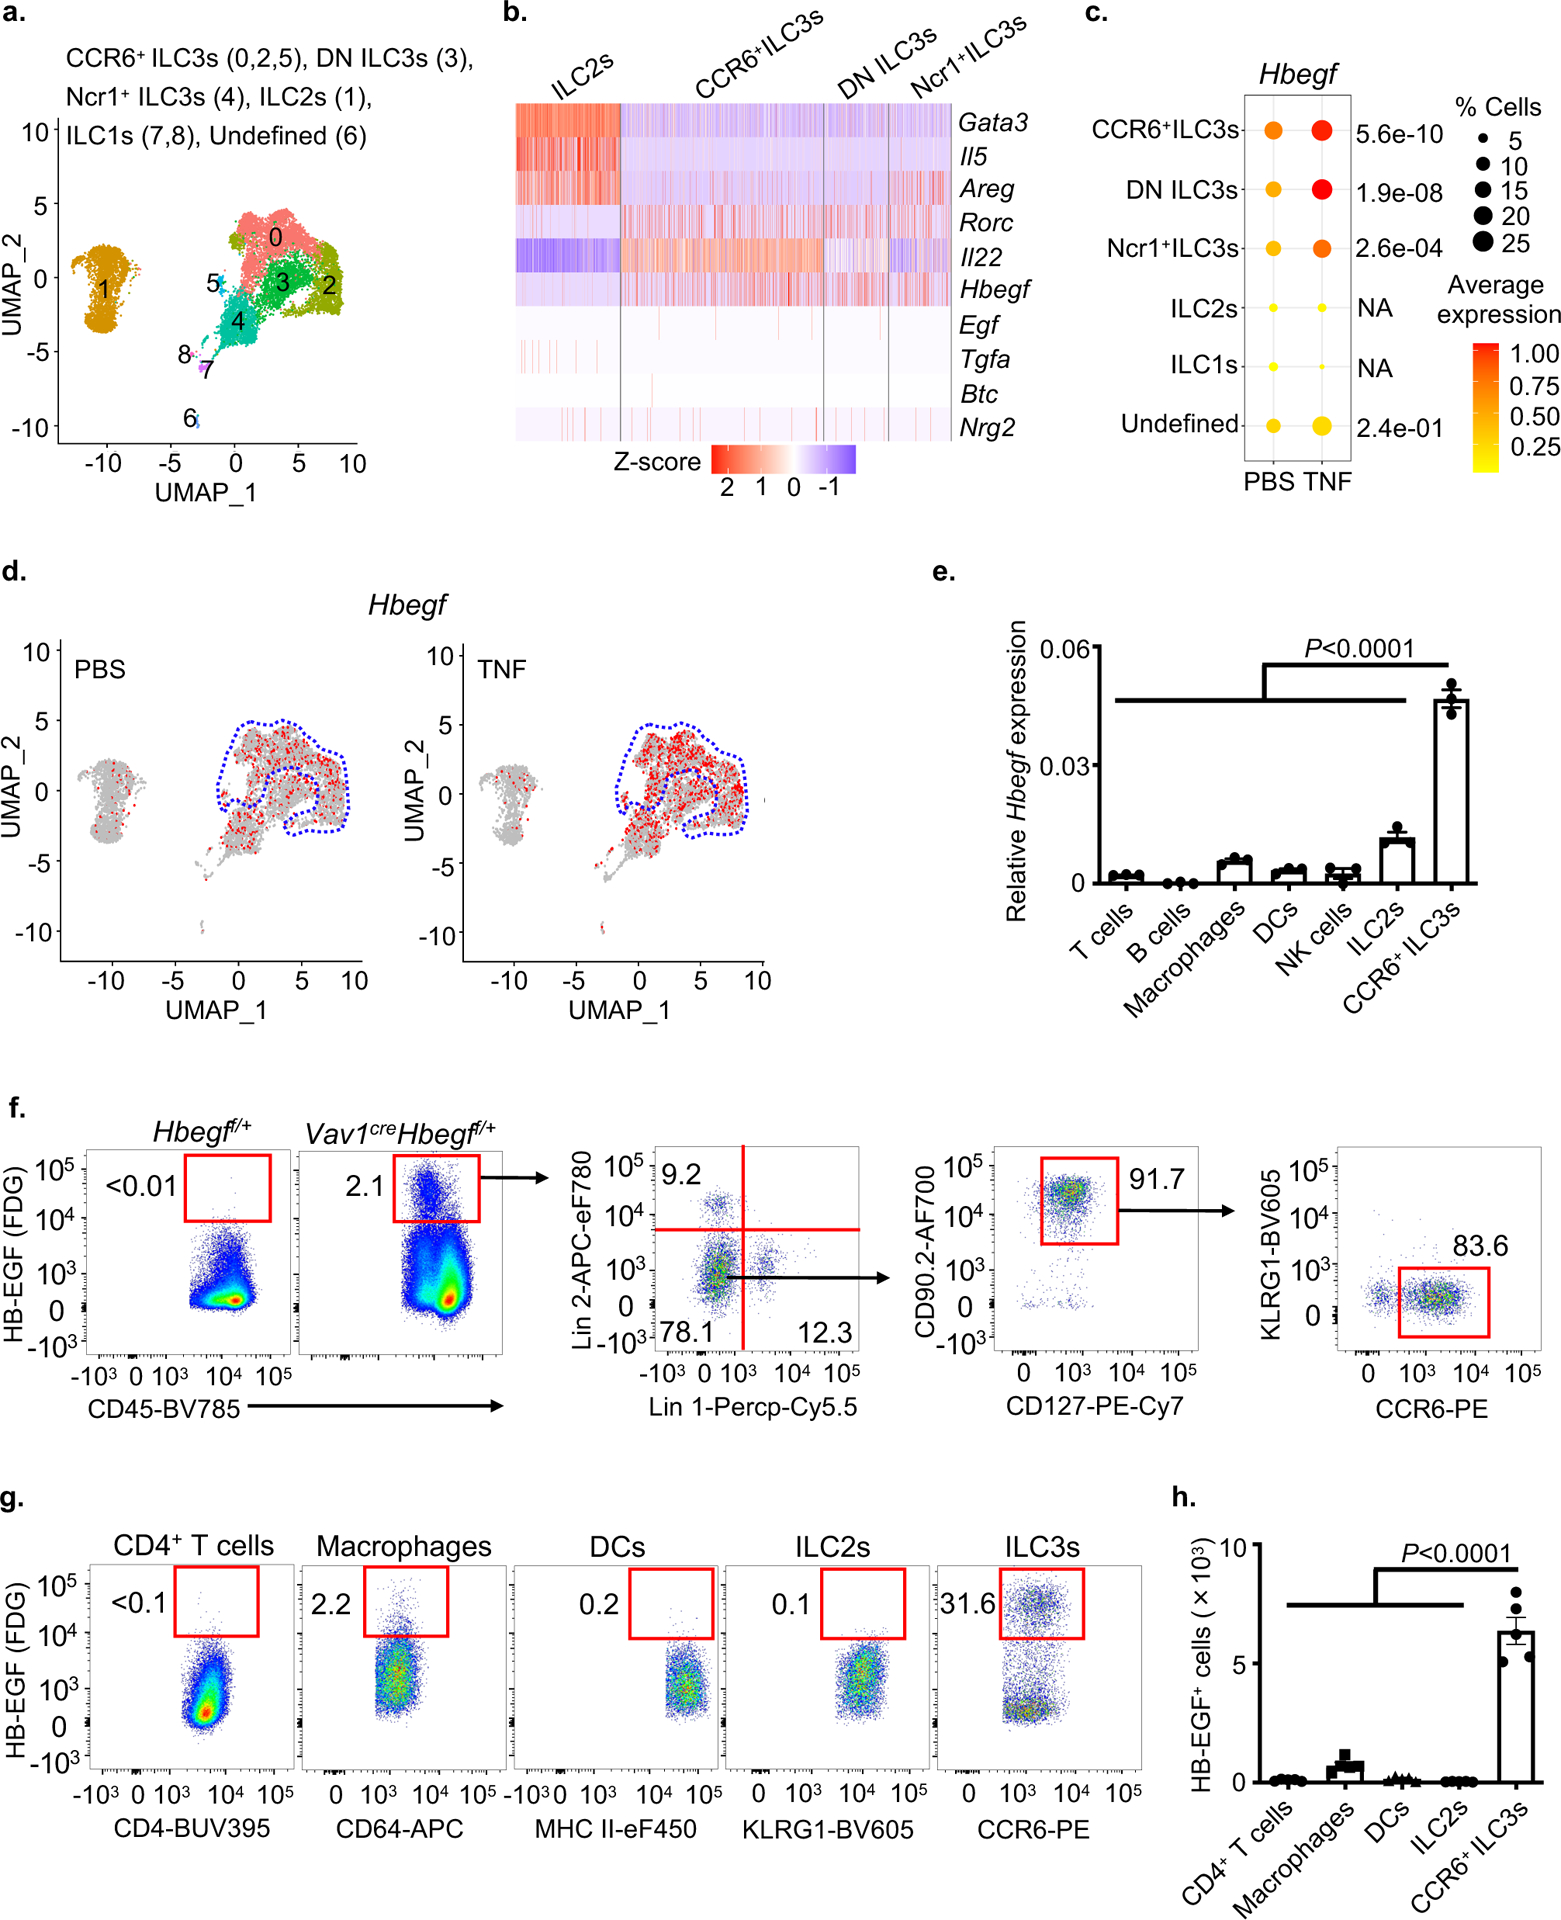
Figure 2. ILC3s are a major cellular source of HB-EGF in the intestine.

a-d. Total ILCs were sort-purified from the small intestine of PBS- or TNF-treated mice and analyzed by scRNA-Seq. Uniform manifold approximation and projection (UMAP) embedding of 11,556 cells (dots), colored by cluster (a). Heatmap showing expression Z-scores of the indicated genes in ILC2s and ILC3s from TNF-treated mice (b). Dot plot shows the mean expression (color) of Hbegf in clusters grouped by cell type as noted, dot size represents the proportion of cells in a cluster with the gene detected (c). UMAP shows the expression of Hbegf gene in all clusters of each treatment condition and the dotted line indicates CCR6+ ILC3 clusters (d). e. Expression of Hbegf in the indicated sort-purified immune cells as determined by qPCR (n=3 individual mice). Relative to Actb. f. Flow cytometry plots show HB-EGF expression in small intestine lamina propria of noted mice as measured by conversion of the fluorescent LacZ substrate fluorescein di-β-d-galactopyranoside (FDG). g and h. Flow cytometry plots (g) and quantification of cell number (h) of HB-EGF+ cells in the small intestine of noted mice as measured by LacZ activity (n=5 individual mice). Lineage 1: CD3ε, CD5, CD8α, NK1.1, TCRγδ. Lineage 2: CD11b, CD11c, B220. Data in e-h are representative of two independent experiments, shown as the means ± S.E.M. Statistics are calculated by one-way ANOVA. DN, double-negative of CCR6 and Ncr1.
