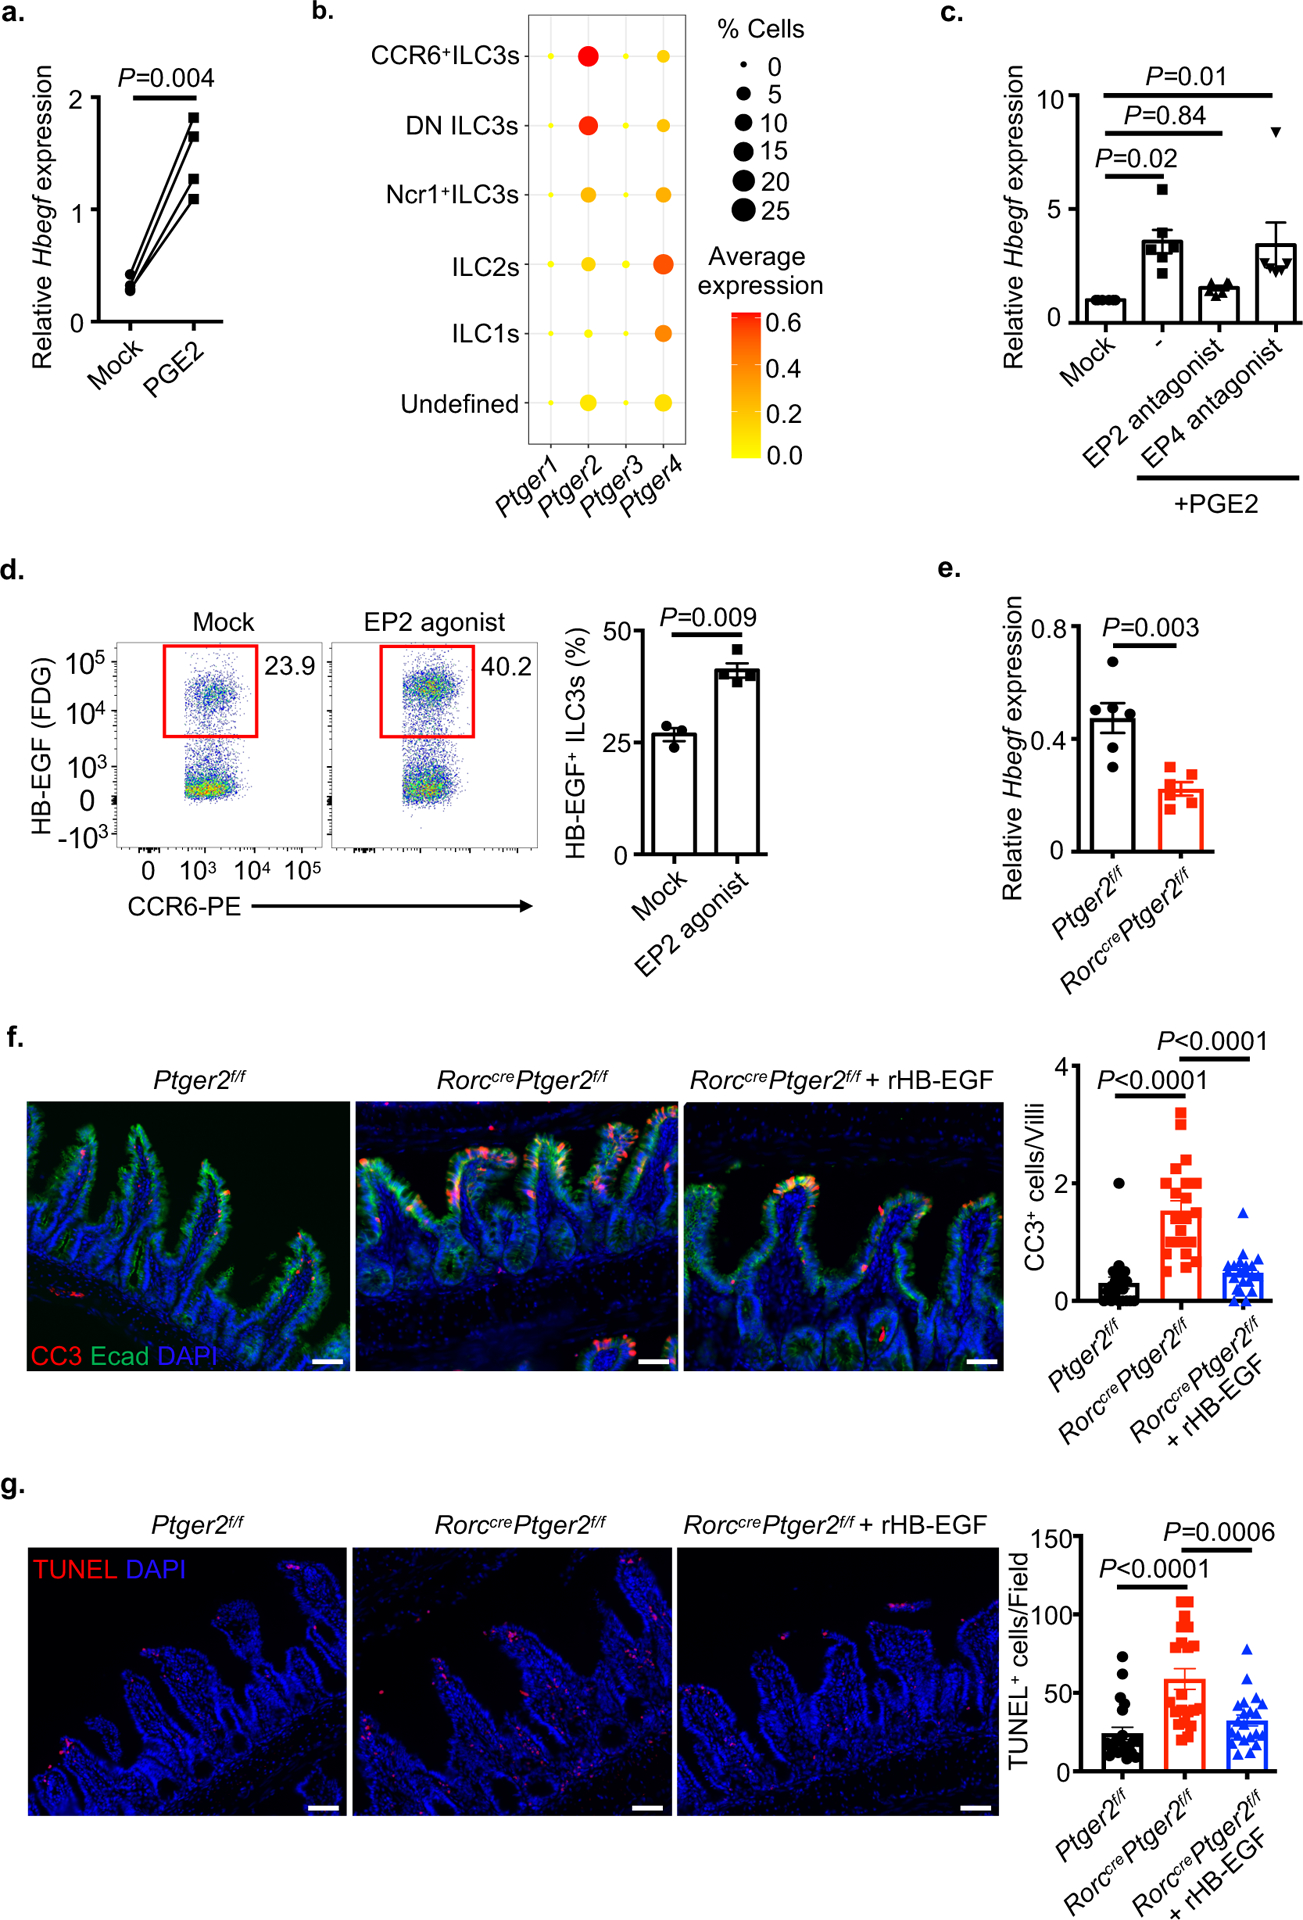
Figure 5. PGE2 elicits ILC3-intrinsic HB-EGF production through the EP2 receptor.

a. qPCR analysis of Hbegf expression in sort-purified ILC3s with or without PGE2 treatment, relative to Hprt (n=4 individual mice). b. Dot plot shows the mean expression (color) of Ptger1-4 in clusters grouped by cell type as noted from the small intestine of TNF-treated mice. c. Sort-purified ILC3s were stimulated with PGE2 in the presence of EP2 or EP4 antagonist, Hbegf expression was then examined by qPCR, relative to Hprt (n=6 individual mice). d. Flow cytometry plots with graph of the frequencies of HB-EGF+ ILC3s in small intestine of RorccreHbegff/+ mice with or without EP2 agonist in vivo treatment (n=3 individual mice in Mock, n=4 individual mice in EP2 agonist). e. ILC3-intrinsic HB-EGF of indicated mice at steady state was determined by qPCR, relative to Hprt (n=6 individual mice). f and g. Representative immunofluorescence sections and quantifications of cleaved-caspase 3 (CC3) (f) (N=3 individual mice per group, n=21 fields per group) or TUNEL (g) (N=3 mice per group, n=21 fields per group) staining of the small intestine from noted mice 4 hours post recombinant TNF injection. Data in a, d, f and g are representative of two or three independent experiments, data in c and e are pooled from two independent experiments, shown as the means ± S.E.M. Statistics are calculated by paired (a) or unpaired (d and e) two-tailed Student’s t-test or one-way ANOVA (c, f and g). Scale bars=50 μm.
