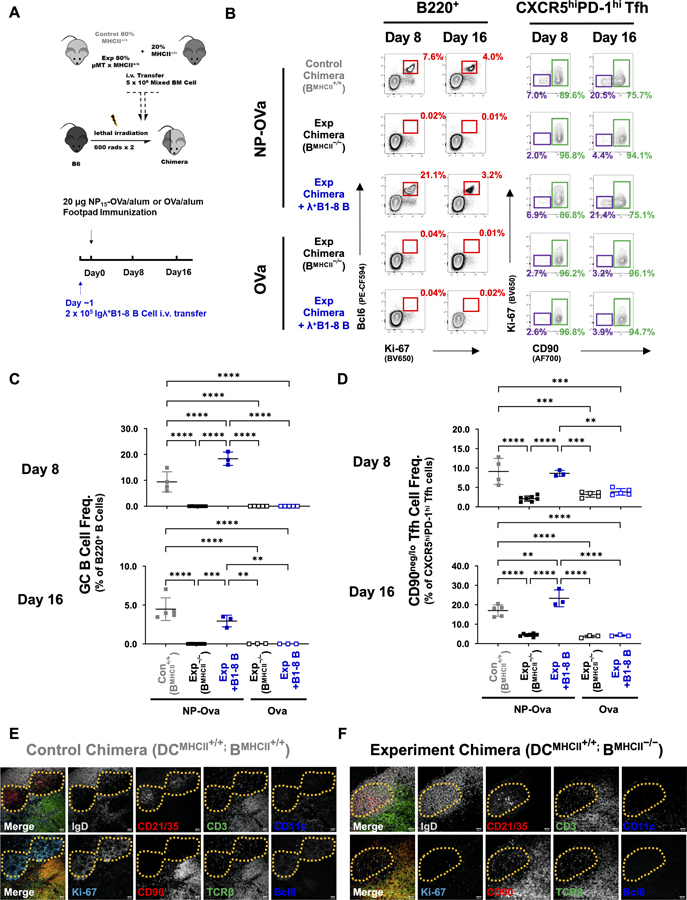
Figure 4. Differentiation and maintenance of CD90neg/lo GCTfh cells requires antigen-specific, MHCII+ B cells.
(A) Diagram of the experimental design. (B) Representative flow cytometry contour plots depicting the frequencies of B220+Bcl6+Ki-67+ GCB cells among B220+ cells (red; left panel) and of CD90neg/lo Ki-67− (CD90neg/lo GCTfh; purple) or CD90hi GCTfh-like (green) cells among all CXCR5hiPD-1hi Tfh cells in pLNs at days 8 and 16 p.i. (C-D) Frequencies of (C) GCB cells among total B220+ B cells and (D) CD90neg/lo GCTfh cells among CXCR5hiPD-1hi Tfh cells at indicated time points (n = 3–8 at each time point; mean ±S.D.). Each symbol represents an individual mouse; data were pooled from at least two independent experiments. Statistical significance was measured using ordinary ANOVA followed by Tukey’s post-test (**P<0.01; *** P<0.001). (E-F) Representative images showing IF analysis of serial sections from the LNs of (E) a control chimera (DCMHCII+/+; BMHCII+/+) and (F) an experimental chimera (DCMHCII+/+; BMHCII−/−). The far left panel in each series depicts the merged signals from the subsequent four panels. Top row: IgD (gray), CD21/35 (red), CD3 (green), CD11c (blue). Bottom row: Ki-67 (cyan), CD90 (red), TCRβ (green), Bcl6 (blue). Dashed yellow lines circumscribe the GC (E) or FDC network (F). Magnification: x200, scale bars 40 μm. Data represent one of two independent experiments with similar results.

