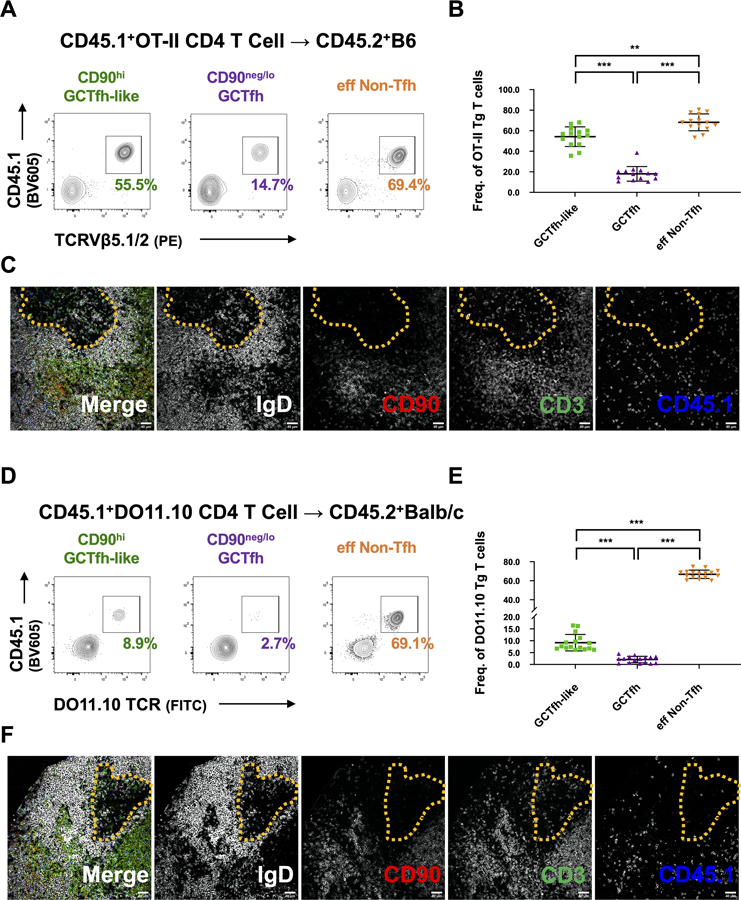
Figure 6. TCR influences the likelihood of CD90neg/lo GCTfh cell differentiation.
CD4+ T cells from (A-C) CD45.1+ OT-II or (D-F) CD45.1+ DO11.10 mice were adoptively transferred into B6 or Balb/c mice. Hosts were subsequently footpad-immunized with 20 μg of NP-Ova+alum. Draining pLNs were analyzed at day 8 p.i. (A) Representative flow cytometry contour plots and (B) summary graph depicting the frequencies of CD45.1+TCRVβ5+ transferred OT-II cells among CD90hi GCTfh-like, GCTfh and eff non-Tfh cells (n = 14; mean ±S.D.). (C) Representative IF images showing cryostat sections from draining pLNs. (D) Representative flow cytometry contour plots and (E) summary graph depicting the frequencies of CD45.1+DO11.10Tg+ transferred cells among CD90hi GCTfh-like, GCTfh and eff non-Tfh cells (n = 16; mean ±S.D.). (F) Representative IF images showing cryostat sections from draining pLNs. (B and E) Each symbol represents an individual mouse LN. Results were pooled from at least two independent experiments. Statistical significance was measured using ordinary ANOVA followed by Tukey’s post-test (**P<0.01; *** P<0.001). (C and F) The far left panel depicts the merged signals from the subsequent four panels. IgD (gray), CD90 (red), CD3 (green), CD45.1 (blue). Dashed yellow lines circumscribe the GC region. Magnification: x200, scale bars 40 μm.

