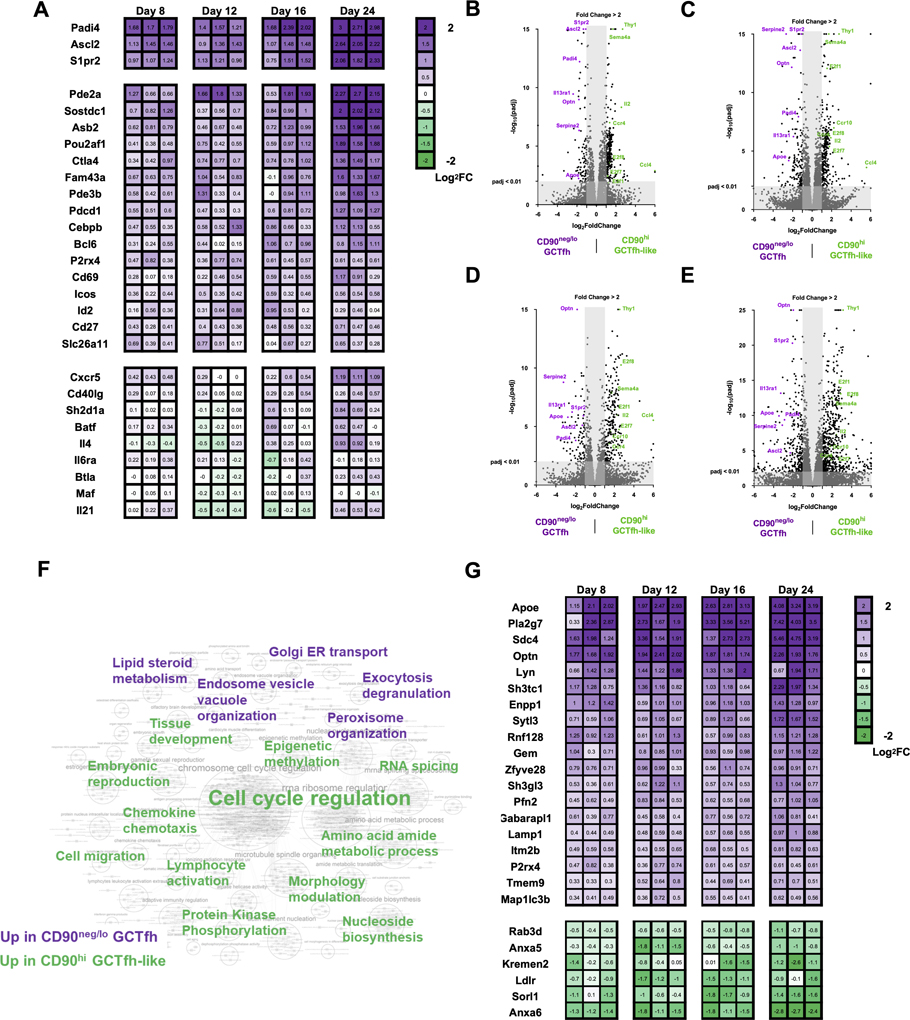
Figure 7. Transcriptional profiling implies functional divergence of CD90neg/lo GCTfh and CD90hi GCTfh-like cells.
FoxP3EGFP mice were footpad-immunized with 20 μg of NP-Ova+alum. Draining pLNs were harvested at days 8, 12, 16 and 24 p.i. CD90neg/lo GCTfh (purple) and CD90hi (green) GCTfh-like cells were sorted from the same pLN and were subjected to ultra-low RNA sequencing. Detailed gating strategies are shown in Fig. S7A. RNA was extracted and then subjected to library preparation and sequencing. Differential gene expression analysis was performed in R by DEseq2. (A) Heatmap graph showing the fold-change of Tfh-related gene expression in CD90neg/lo GCTfh over CD90hi GCTfh-like cells in each individual pLN. Numbers indicate the log2 fold-change in gene expression (n = 3 at each time point). (B-E) Volcano plots depicting genes up- or down-regulated with fold-change ≥ 2 and adjusted P value < 0.01 in CD90neg/lo GCTfh cells relative to CD90hi GCTfh-like cells at (B) day 8, (C) day 12, (D) day 16 or (E) day 24. (F) GSEA of RNASeq data. Significant gene sets with FDR < 0.1 or p < 0.01 were visualized with Cytoscape and Enrichment Map. The keyword graph represents the annotated results for clustered gene set comparisons. Purple keywords denote the physiological signature enriched in CD90neg/lo GCTfh cells and green words represent the physiological signature enriched in CD90hi GCTfh-like cells. A detailed graph and lists of gene set comparison information are shown in Fig. S7E and Table S1. (G) Heatmap graph showing the fold-change in expression of significantly (p<0.05) up- or down-regulated genes associated with endosomal vesicle organization and exocytosis/degranulation in CD90neg/lo GCTfh over CD90hi GCTfh-like cells. Numbers indicate the value of log2 fold-change in gene expression (n = 3 at each time point).

