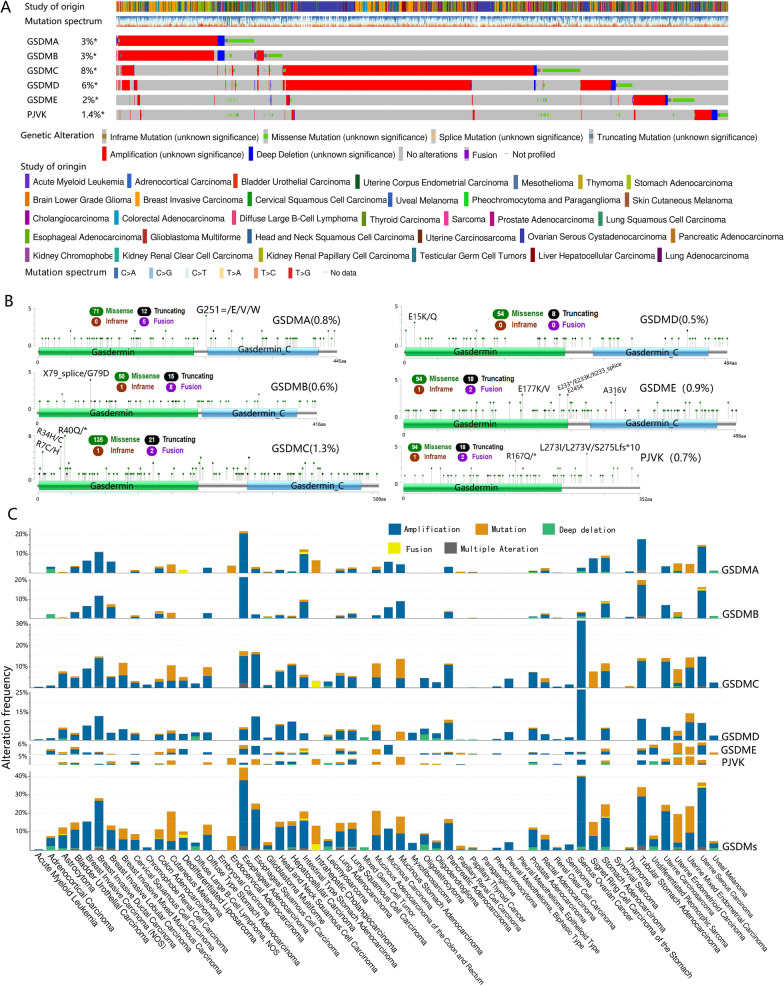
Fig. 1.
Alteration of GSDM family genes. A An OncoPrint showing GSDM genetic alterations across TCGA cancer studies. Each sample was represented as a column and each GSDM gene was represented as a row. The alterations were represented in different colors. B Representation of the mutations along GSDM genes. Green dots represent missense mutations, black dots represent truncating mutations, brown dots represent in-frame mutations and purple dots represent gene fusions. C Alteration frequency, mutation, copy number alteration (CNA) and gene fusion of GSDM genes across cancer types

