Fig. 2.
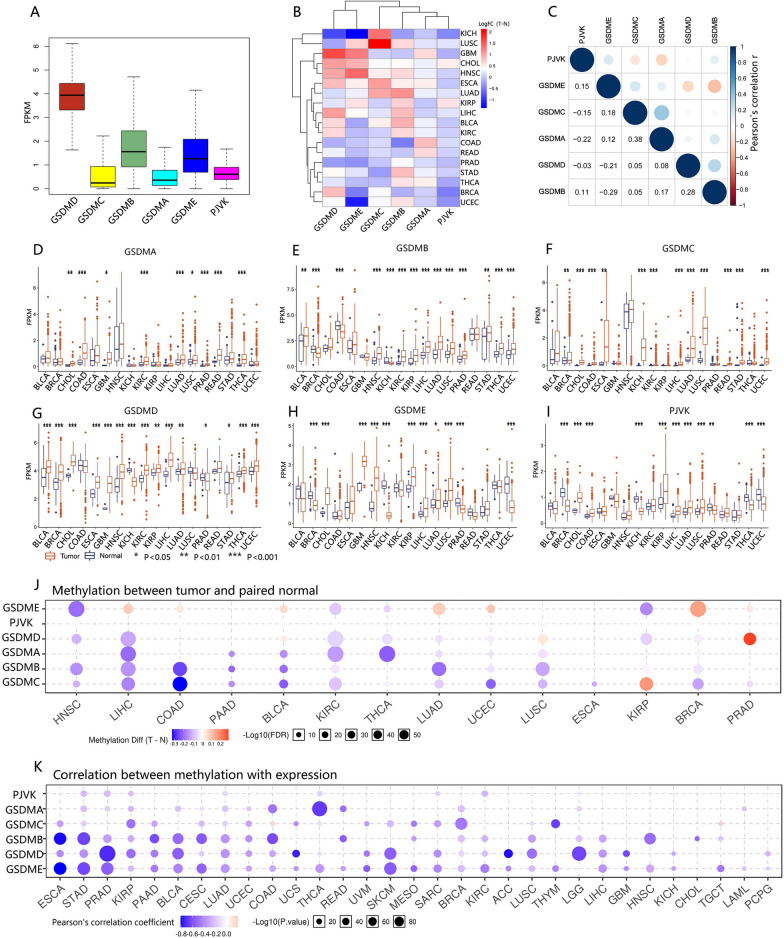
The expression of GSDM family genes. A Box plots represent the relative expression of GSDM genes in pan-cancer. B Heatmap showing differential expression of GSDM genes across cancer types. C Matrix graph of Pearson’s correlation of GSDM genes expression in pan-cancer. D–I Box plots represented the differential expression of six GSDM genes between tumor and normal tissue. J Methylation difference between tumor and paired normal tissue. P value was adjusted by FDR, FDR < = 0.05 was considered as significant. Only significant results were shown as bubble plots. K Pearson’s Product-moment Correlation between GSDM genes expression and corresponding gene methylation. P-value was adjusted by FDR and genes with FDR < = 0.05 will be showed

