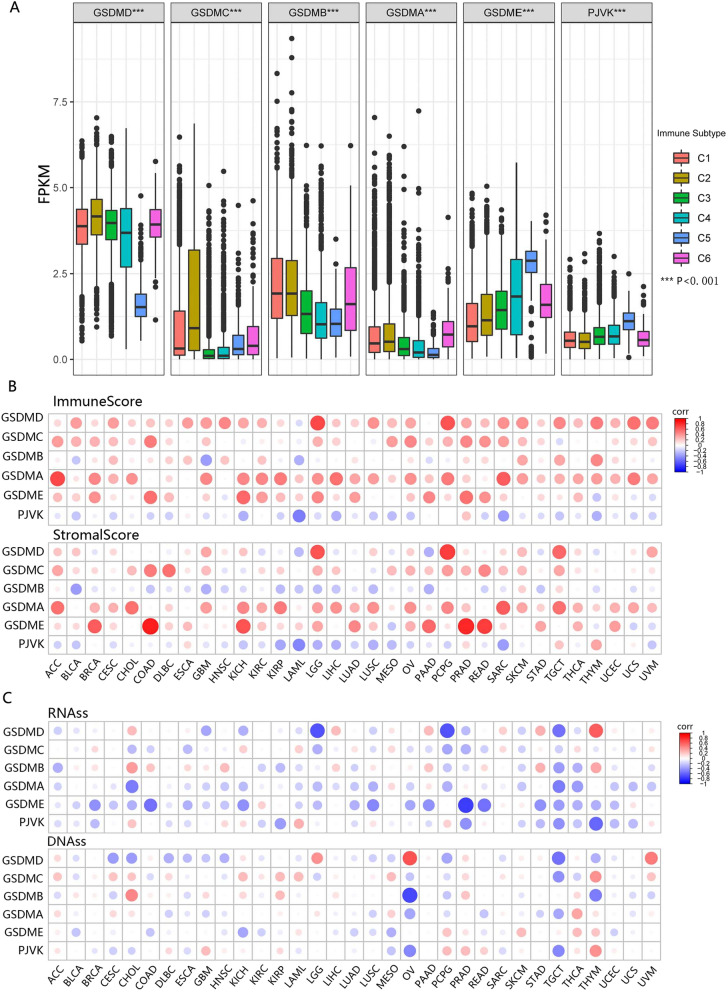
Fig. 5.
The differential expression of GSDM genes across immune subtypes and the association between GSDM genes expression and TME/DNAss/RNAss. A The distribution of GSDM expression across immune subtypes. C1 (wound healing); C2 (IFN-gamma dominant); C3 (inflammatory); C4 (lymphocyte depleted); C6 (TGF-b dominant). B Matrix graph of Spearman's Rank-Order Correlation between GSDM genes expression and Immunescore/Stromascore. Cancer types and GSDM genes were shown on the horizontal and vertical axis respectively. C Correlation matrix between GSDM genes expression and cancer stemness scores RNAss and DNAss. Cancer types and GSDM genes were shown on the horizontal and vertical axis respectively

