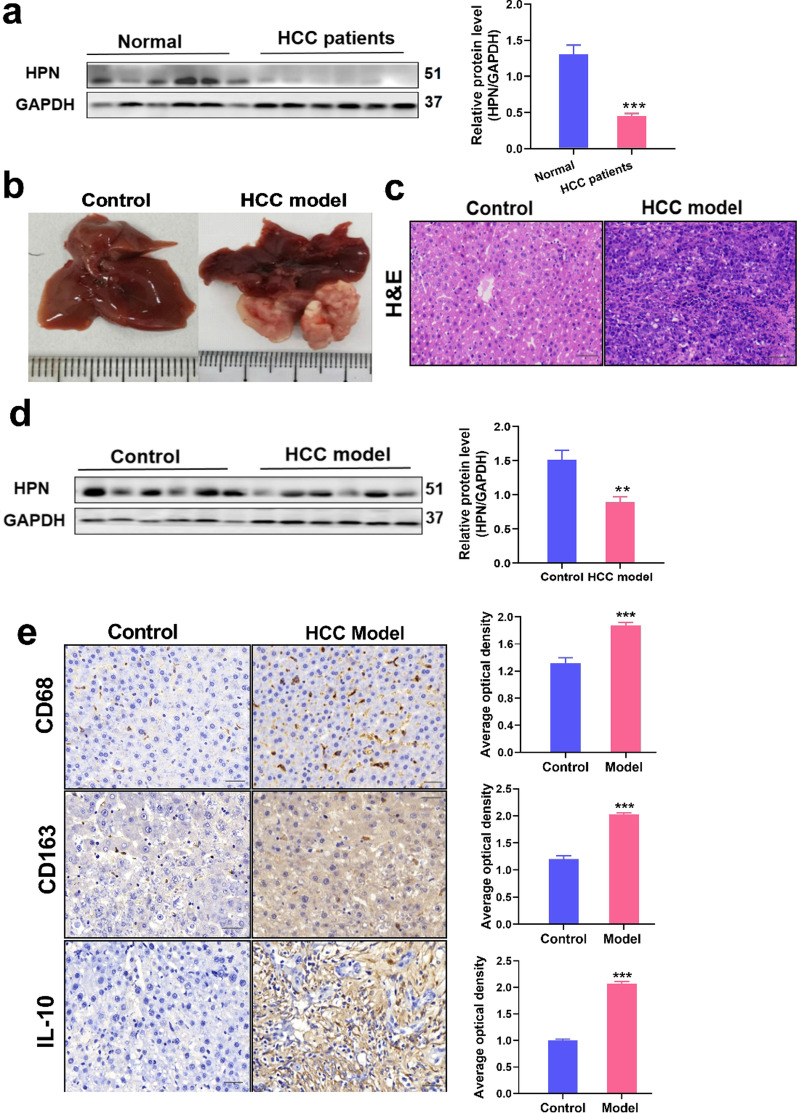
Fig. 8.
Verification of decreased HPN expression in HCC and correlation with expression of marker genes for immune cells. a Western blot analysis of HPN in another cohort of human samples. General picture (b), representative images of H&E staining (c) and western blot analysis of HPN (d) in a BALB/c mouse model. e Representative images of immunohistochemical staining for CD68, CD163 and IL-10 in a BALB/c mouse model (Scale bar, 100 μm). Data are expressed as mean ± SEM. Statistical analysis was performed according to a Mann–Whitney test. Normal means healthy subjects based on human liver samples. Control means control group based on the HCC mouse model. H&E, haematoxylin and eosin. **P < 0.01, ***P < 0.001 vs Normal or Control. HCC hepatocellular carcinoma. (n = 6 for each group)

