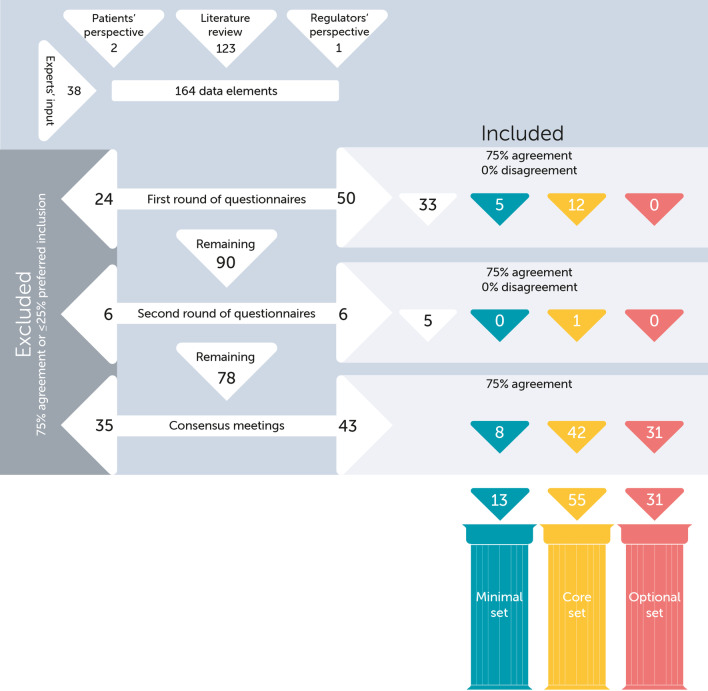
Fig. 3.
Flow chart of data elements in the modified Delphi study. 164 data elements were discussed leading to inclusion of 99 after two rounds of questionnaires and two consensus meetings. Two decisions are visualized, (1) inclusion/exclusion and (2) minimal/core/optional. White corresponds to unconsented or excluded data elements, or data elements that are included but still need to be allocated to the minimal/core/optional set. Blue corresponds to the minimal set. Yellow corresponds to the core set. Coral red corresponds to the optional set

