Fig. 7.
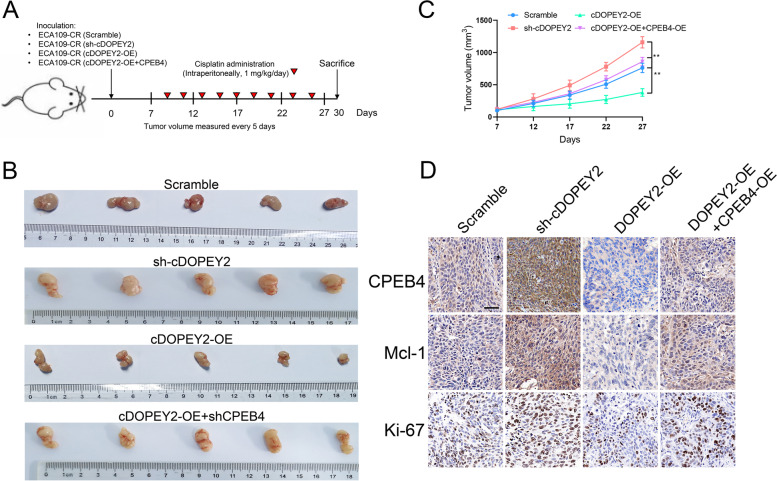
cDOPEY2 attenuates cisplatin resistance in vivo. A Schematic diagram demonstrating the grouping and treatment plan of the xenograft model; BALB/c nude mice were inoculated with the indicated cells (5 × 10⁶) and treated with cisplatin (i.p., 1 mg/kg) every two days until the tumor volume exceeded 100 mm3. B Representative images of the inoculated tumor tissues of each group. C Time-course evaluation of the tumor volumes in the indicated groups as measured every 5 days and tumor weights measured after tumors were harvested. D IHC staining showing the abundances of CPEB4, Mcl-1, and Ki-67 in the indicated groups. Scale bars, 100 μm. Data are presented as the mean ± SD. *P < 0.05, **P < 0.01, ***P< 0.001. P values were determined by one-way ANOVA with Tukey’s post hoc test

