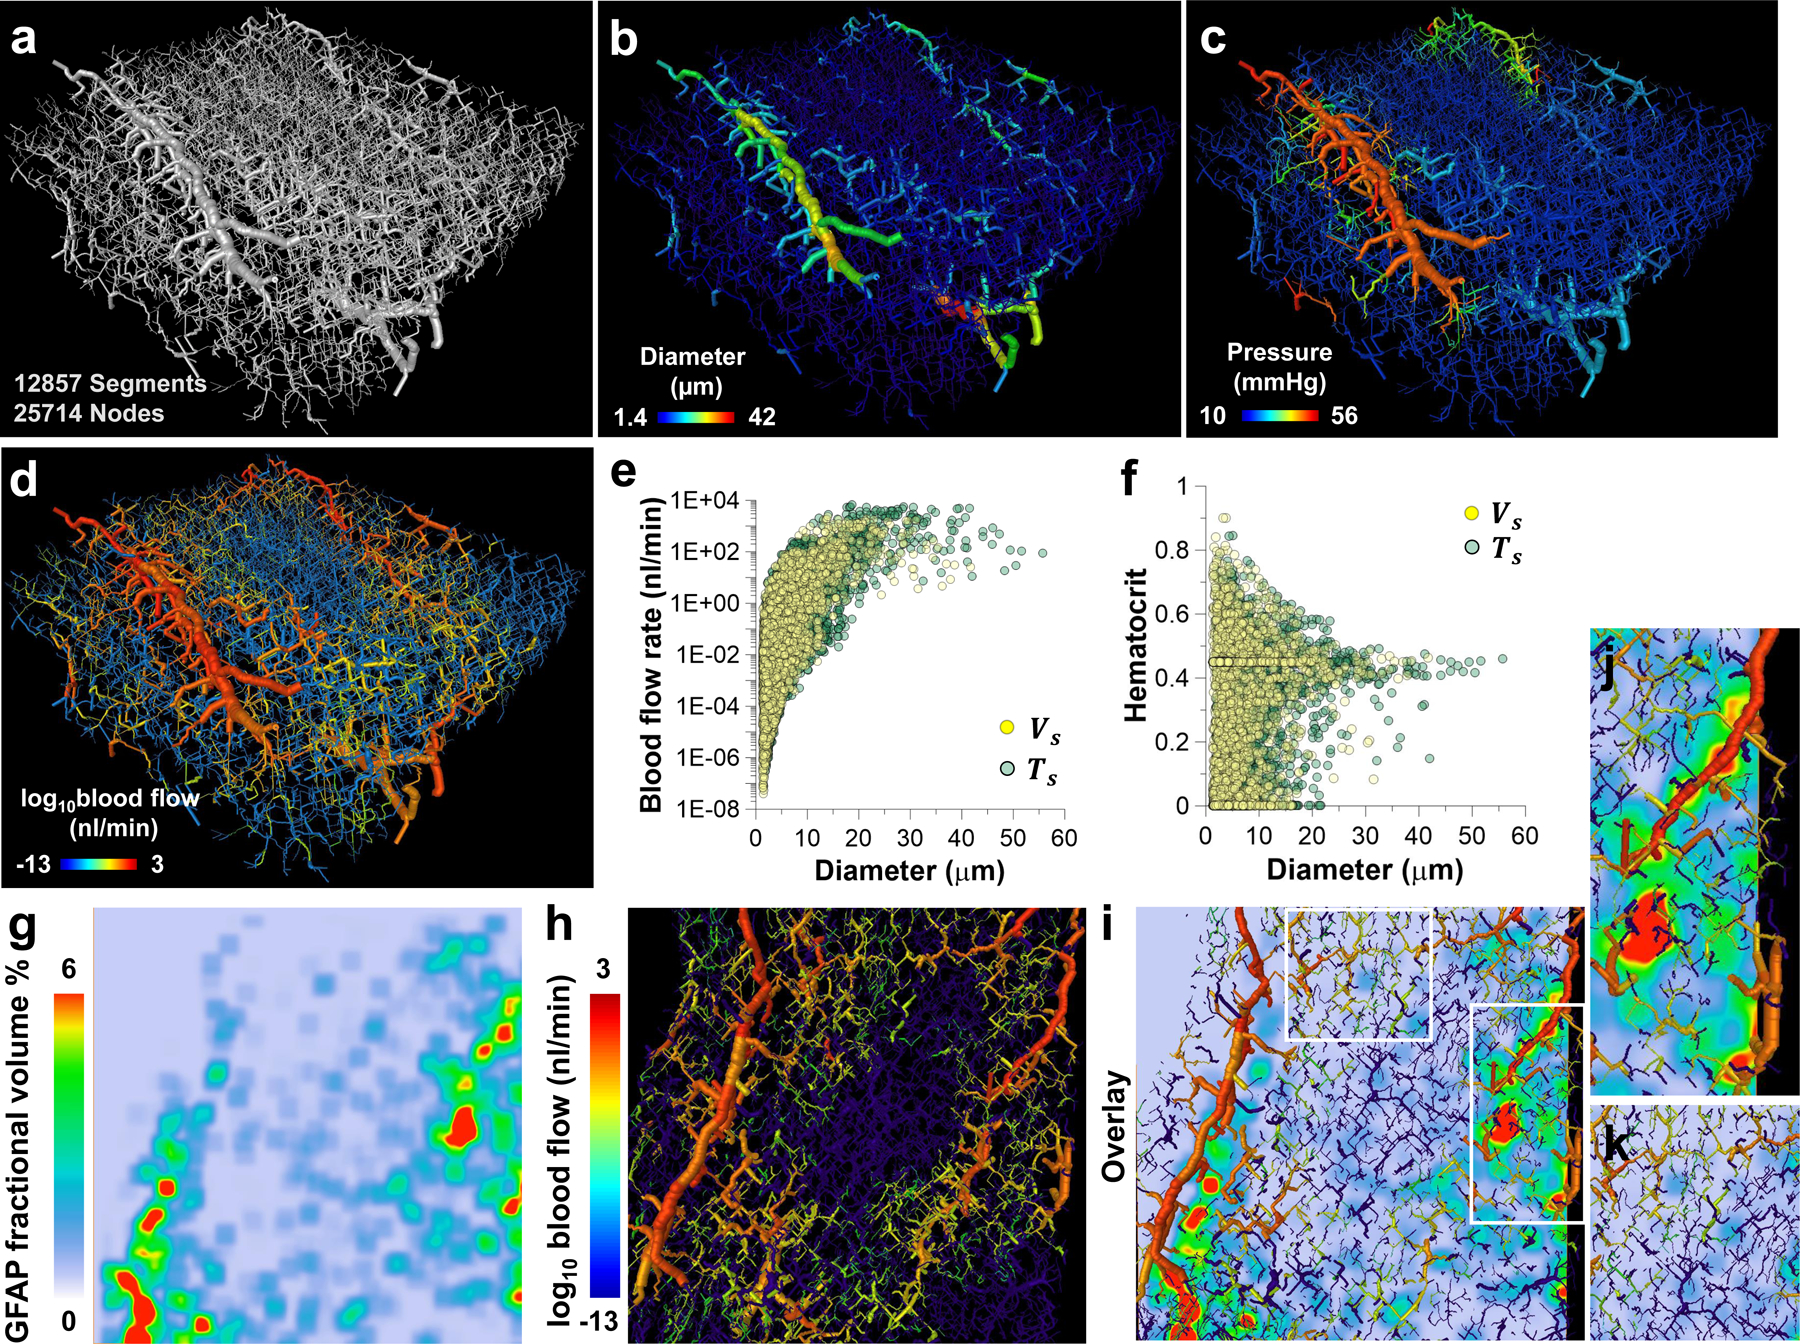
Fig. 5: Computationally generated hemodynamic contrast from VascuViz-derived 3D neurovascular data.

The polymer bearing murine brain tissue section was optically cleared and imaged at a high spatial resolution (0.33 μm) using LSM. (a) A 300 μm × 300μm × 100 μm FOV of the thalamic microvasculature was extracted from the 3D LSM data. (b) Diameter map of the microvascular network in (a), wherein each blood vessel was scaled and color-coded by its mean diameter (1.4–42 μm). (c) Map of the simulated intravascular pressure (mmHg) wherein each blood vessel was scaled by the mean diameter and color-coded by the average pressure across its end points. (d) Map of the simulated blood flow (nl/min) wherein each blood vessel was scaled by the mean diameter and color-coded by the log of the blood flow. Scatter plots of: (e) blood flow (nl/min) vs. blood vessel diameter (μm), and (f) hematocrit vs. blood vessel diameter (μm). Data are shown for two cases: Case I (yellow circles) employed a vessel-based scaling factor ( = 1.25); and Case II (green circles) employed a tissue-based scaling factor (= 1.67) to account for vascular shrinkage due to tissue clearing. These simulated data were complemented with the fractional volume of the GFAP label computed from LSM data (0.33 μm) as shown in (g-k). (g) Map of the LSM-derived fractional GFAP volume (%) corresponding to a z-location 30 μm below the top plane in volume (a); (h) blood flow (nl/min) map corresponding to the same z-location; (i) overlay of the fractional GFAP volume (%) (g) and blood flow (nl/min) (h). White boxes in (i) highlight ROI in which elevated blood flow (nl/min) co-localized with high fraction of GFAP labeling (> 4%), and (j) ROI in which low blood flow (nl/min) co-localized with low fraction of GFAP labeling (< 4%) (k).
