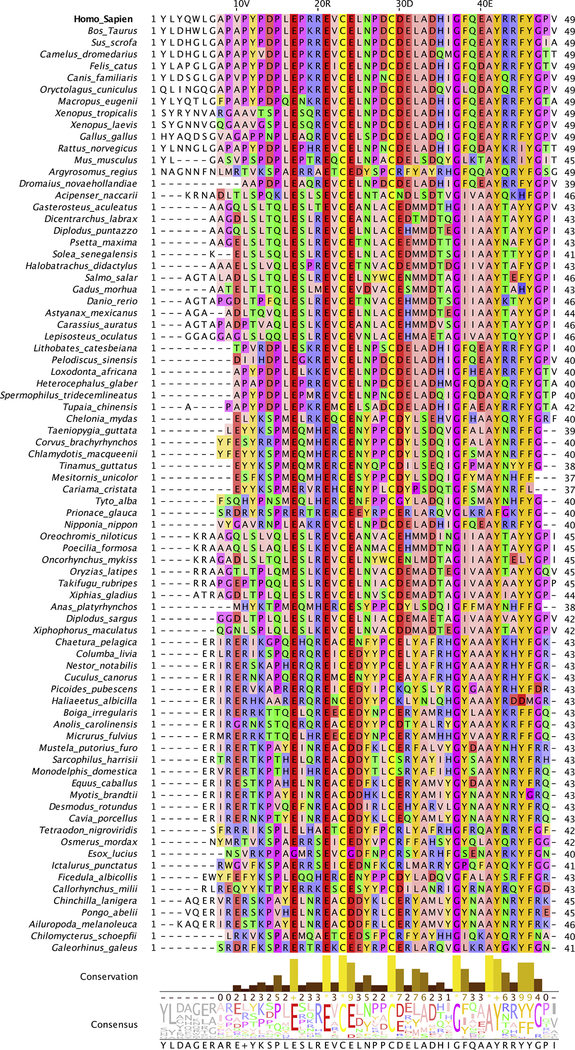
Fig. 1.
Multiple sequence alignment of Ocn sequences. Human Ocn alignment with homologous sequences from other species is shown (only single sequences from each species displayed). The residues are colored according to their physio-chemical properties (Zappo coloring scheme), with aliphatic/hydrophobic residues (ILVAM) shown in pink, aromatic residues (FWY) in orange, positively charged residues (KRH) in blue, negatively charged residues (DE) in red, hydrophilic residues (STNQ) in green, conformationally special residues (PG) in purple, and cysteine (C) in yellow. Conservation between the different sequences is visualized as histograms with their heights, and color variation from yellow to brown, reflecting the level of conservation of physico-chemical properties in the alignment. Conserved and identical amino acid columns show the highest score of 11 and are indicated by ‘*’ whereas conserved and similar amino acid columns show a score of 10 and are indicated by ‘+’. Other groupings are indicated by lower scores accordingly. The consensus sequence logo indicates the relative frequency of occurrence of residues per column which can be estimated by its size in the logo. Below the logo, percentage of modal (top) residue for every column is also displayed. If the top value is shared by more than one residue, a ‘+’ symbol is displayed instead.

