Fig. 2.
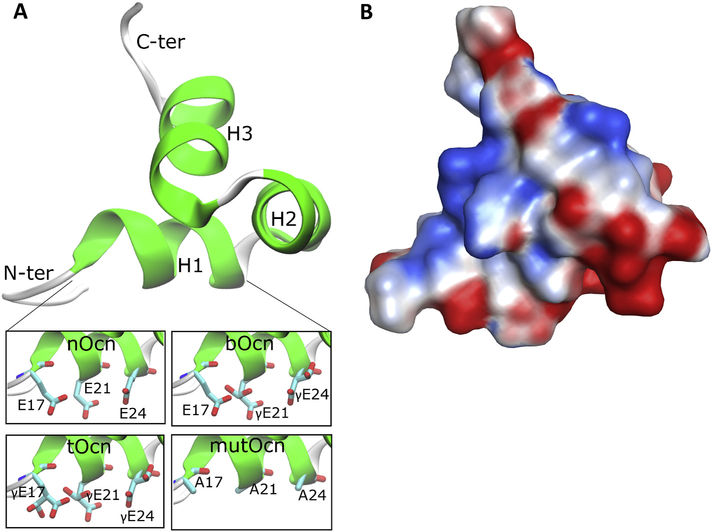
Structural features of Ocn. (A) The starting Ocn homology model is shown in new cartoon representation. The insets at the bottom show the different forms of Ocn (H1 helix) generated by carboxylation of the Glu residues at the 17, 21 and 24 positions in the starting homology model, along with the mutated Ocn generated by mutating these residues to Ala. (B) Electrostatic surface of the Ocn structure generated from the homology model and present in the same orientation as structure in (A). The red color represents electrostatically negative region and blue represents positive region.

