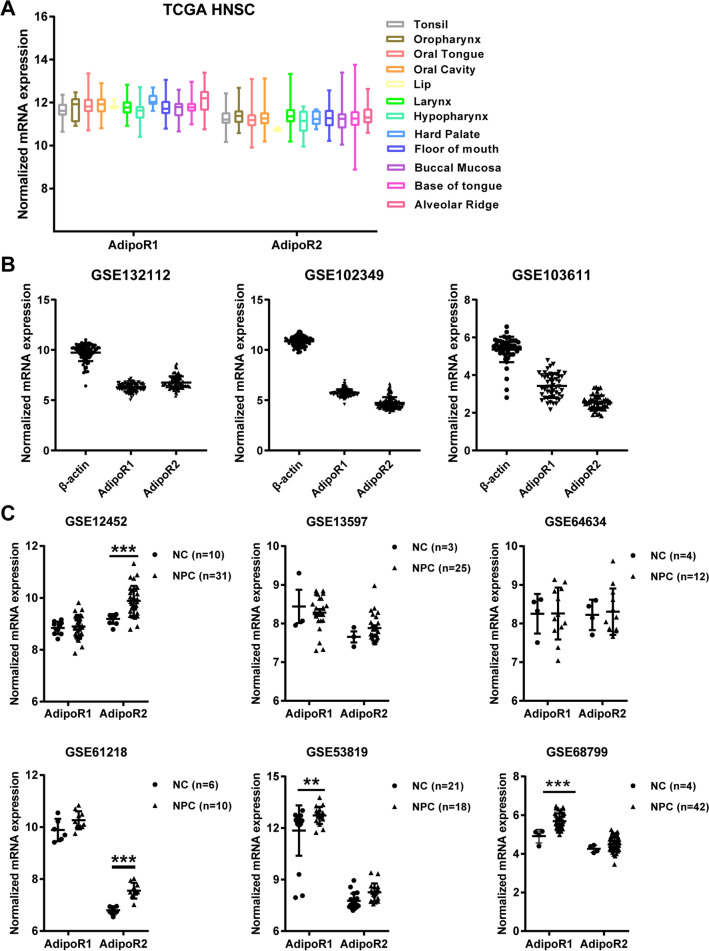
Fig. 4.
The expression of AdipoR1 and AdipoR2 in human HNSC and NPC. A Box plots (derived from TCGA RNA-sequencing dataset) showing the expression of AdipoR1 and AdipoR2 in head and neck squamous cell carcinoma (HNSC). The boxes represent the 25th and 75th percentiles, the lines represent the median, and whiskers show the minimum and maximum points. B The mRNA expression levels of AdipoR1 and AdipoR2 were analyzed in NPC tissues from the GEO datasets. C The relative mRNA expression of AdipoR1 and AdipoR2 in normal and NPC samples from GEO datasets. Data are expressed as normalized expression units. Data are presented as mean ± SD. **P < 0.01, ***P < 0.001

