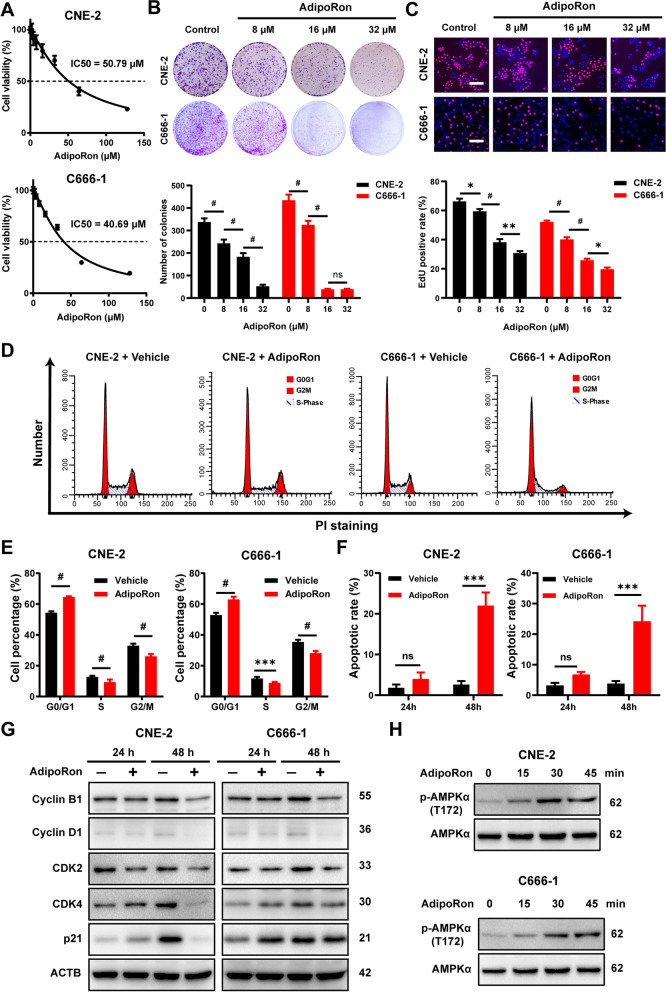
Fig. 5.
AdipoRon suppresses proliferation of NPC cells in vitro. A Cell viability results for CNE-2 and C666-1 cells following the treatment with various concentrations of AdipoRon for 72 h. B Colony-formation ability for CNE2 and C666-1 cells treated with vehicle, 16 or 32 μM AdipoRon for 7 days. The graphs show the number of colonies. C Cell proliferation for CNE-2 and C666-1 treated with vehicle alone, 16 or 32 μM AdipoRon for 48 h. Bars: 50 μm. Graphs show the relative cell proliferation percentage. D, E Flow cytometric analysis of cell cycle progression of CNE-2 and C666-1 cells following the treatment of AdipoRon for 24 h. The comparison of the percentage of cells in different cell-cycle phases between AdipoRon-treated cells and corresponding control cells. F Annexin V/7-AAD staining of CNE2 and C666-1 cells following 24 h or 48 h of exposure to 50 μM AdipoRon. Cell death was then analyzed using flow cytometer. G The cells were treated with vehicle alone or 50 μM AdipoRon for 24 h and 48 h. Western blot analysis was performed to determine the cyclin B1, cyclin D1, CDK2, CKD4 and p21 protein level. H CNE-2 and C666-1 cells were treated with 50 μM AdipoRon for the indicated time period. The p-AMPKα (T172) protein levels were determined by Western blot analysis. Results are presented as mean ± SD of three independent experiments performed in triplicate. *P < 0.05, **P < 0.01, ***P < 0.001, #P < 0.0001

