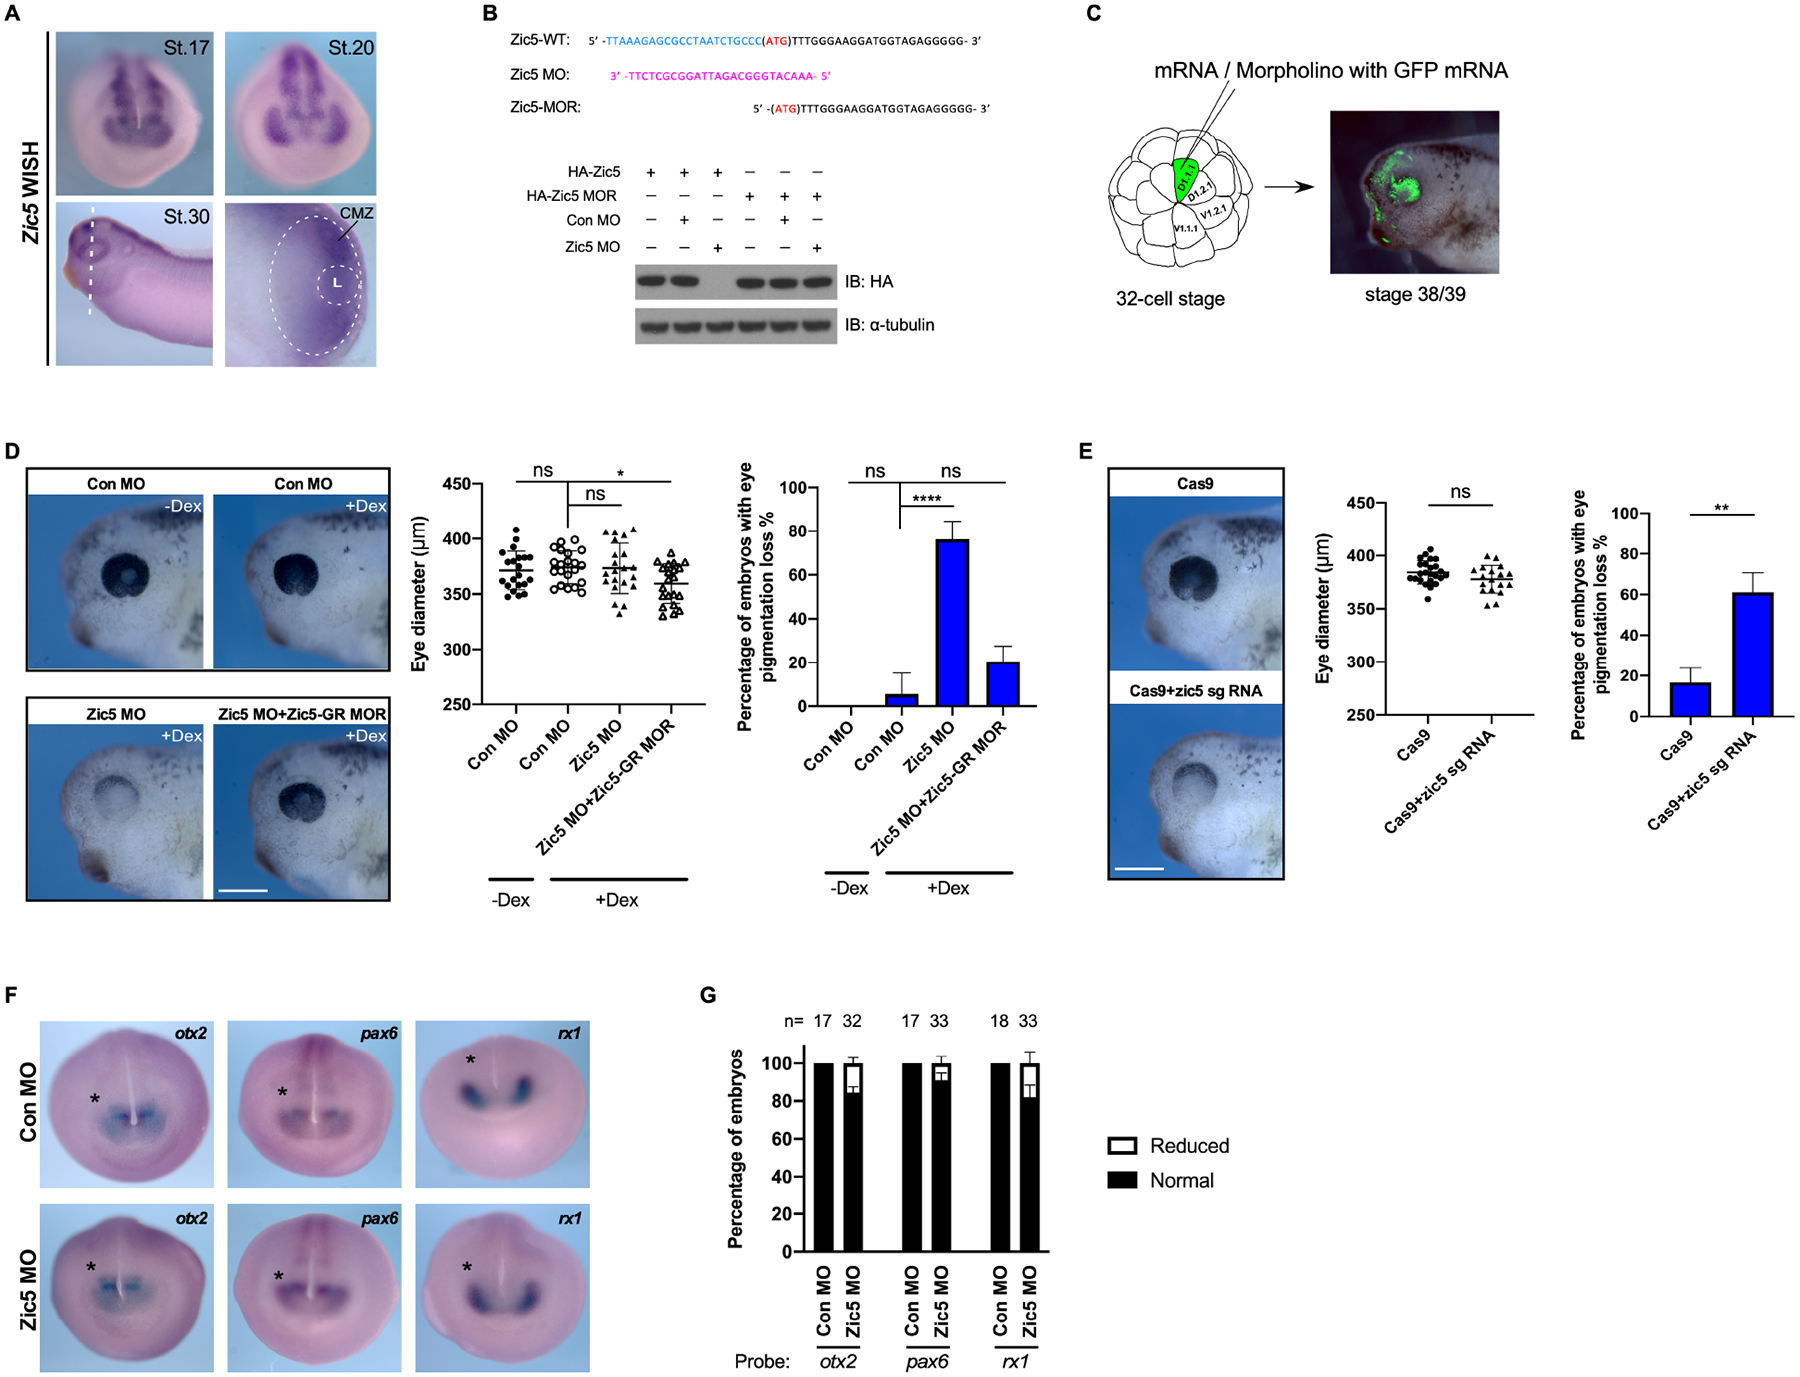
Figure 1. Zic5 is required for normal eye development in Xenopus.

(A) Whole-mount in situ hybridization with Xenopus Laevis Zic5 probe at indicated stages. The white dotted oval outlines the retina. The smaller dotted circle outlines the lens. L, Lens.
(B) Zic5 MO efficiently blocks exogenous Zic5-WT expression, while the injection of the MO-resistant mutant (Zic5-MOR) mRNA is not affected by the MO. Above the blot is a depiction of the wild-type Zic5 nucleotide sequence near the ATG start codon, the Zic5 MO sequence, and the MO-resistant mRNA sequence.
(C) Scheme for microinjection into the D.1.1.1 blastomere at the 32-cell stage. The D.1.1.1 blastomere is a major contributor to retina and the lineage (green) can be traced at tadpole stages.
(D) Knockdown of Zic5 causes pigmentation loss in the eye. Eye diameter was quantified with one-way ANOVA (Dunnett’s multiple comparisons test). Scatterplots represent means ± s.d from three biological repeats, ns: no statistical differences between the groups. Scale bar, 400 μm. Percentage of embryos with eye pigmentation loss was quantified with one-way ANOVA (Dunnett’s multiple comparisons test). Histograms represent means ± s.d from three biological repeats, *, P<0.05, ****, P<0.0001, ns: no statistical differences between the groups.
CRISPR/Cas9 knockout of Zic5 in F0 embryos results in pigmentation loss in the eye. Eye diameter was quantified with unpaired t test. Scatterplots represent means ± s.d from three biological repeats. ns: no statistical differences between the groups. Scale bar, 400 μm. Percentage of embryos with eye pigmentation loss was quantified with unpaired t test. Histograms represent means ± s.d from three biological repeats, **, P<0.01.
(E) Control morphants and Zic5 morphants were analyzed by whole-mount in situ hybridization with eye filed probes Rx1, Pax6 and Otx2 at stage 18.
(F) Histograms represent the percentage of embryos with normal or reduced expression of Rx1, Pax6 and Otx2 from two biological repeats.
