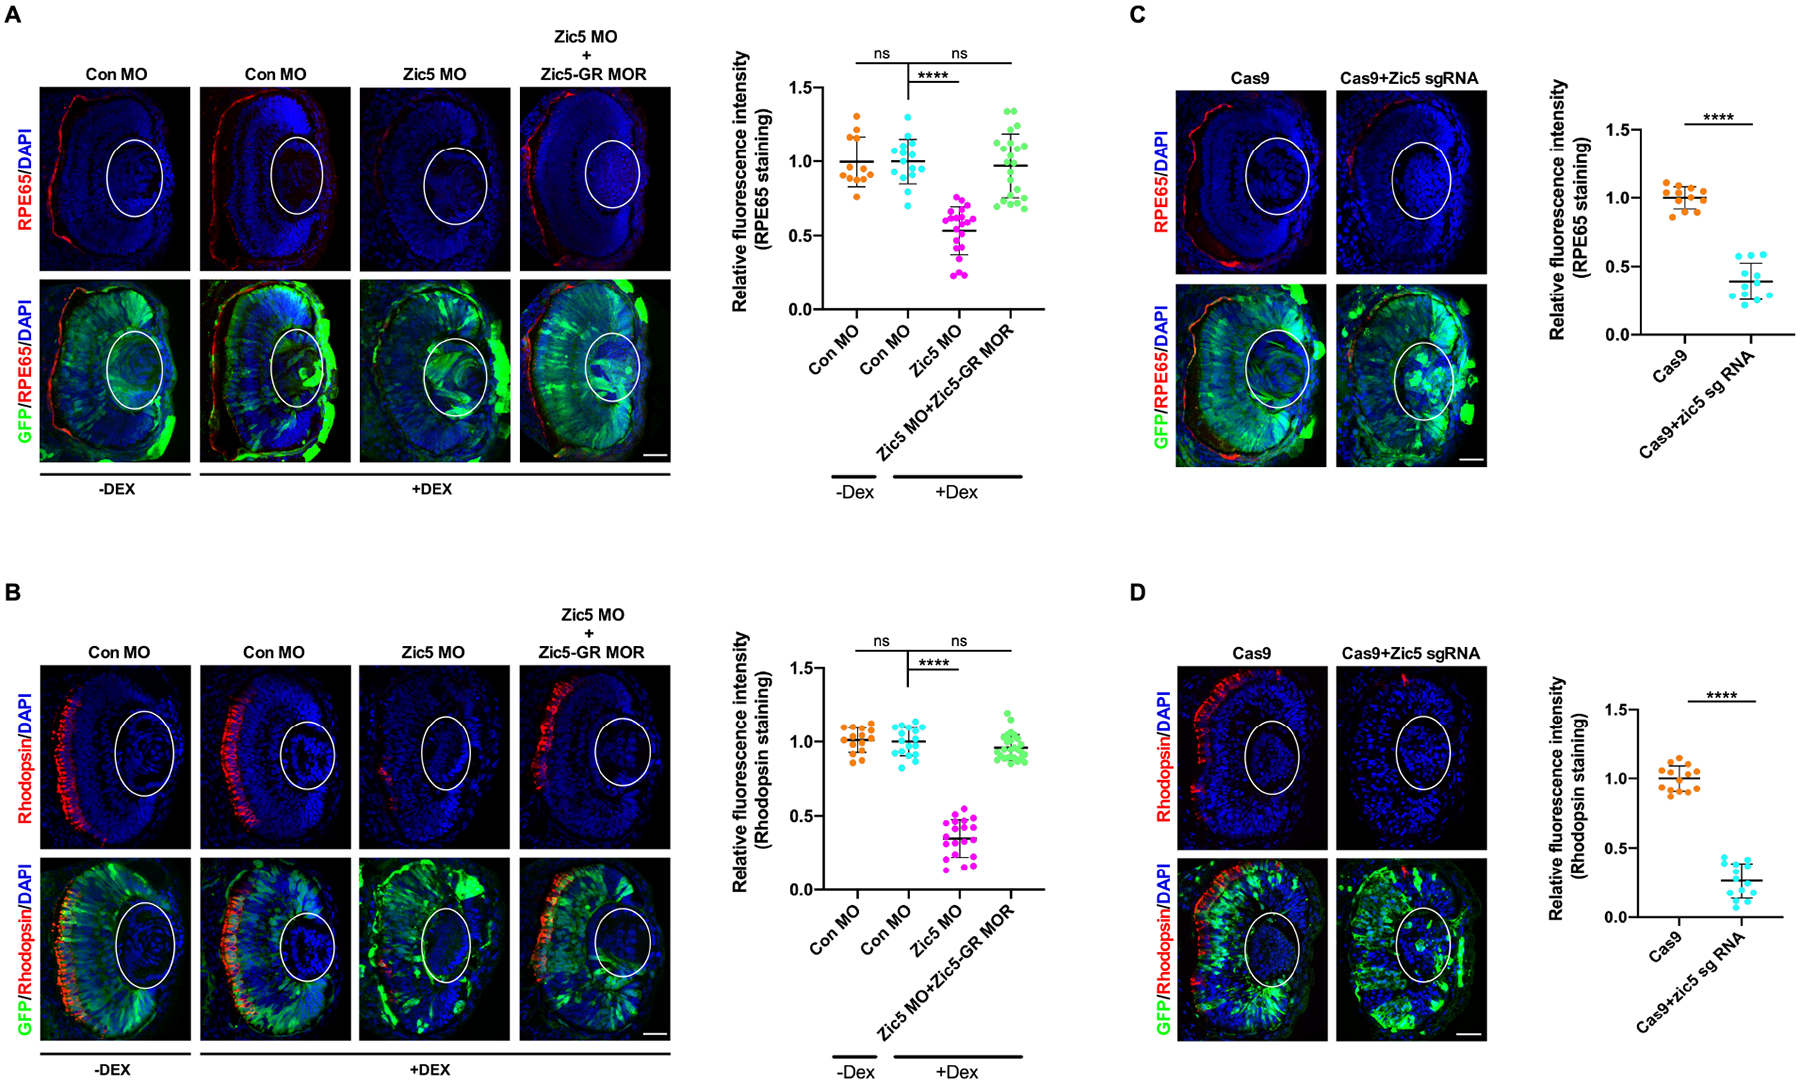
Figure 2. Zic5 is a major regulator for the differentiation of RPE and the rod photoreceptor layer.

(A) Knockdown of Zic5 impairs RPE layer differentiation as marked by RPE65 immunostaining. The lens is outlined with white oval. Quantification of relative RPE65 fluorescence intensity with one-way ANOVA (Dunnett’s multiple comparisons test), ****, P < 0.0001. Scatterplots represent means ± s.d from three biological repeats. ns: no statistical differences between the groups. Scale bar, 40μm
(B) Knockdown of Zic5 impairs rod photoreceptor layer differentiation as marked by Rhodopsin immunostaining. Quantification of relative rhodopsin fluorescence intensity with one-way ANOVA (Dunnett’s multiple comparisons test), ****, P < 0.0001. Scatterplots represent means ± s.d from three biological repeats. ns: no statistical differences between the groups. Scale bar, 40μm
(C) Zic5 knockout impairs RPE layer differentiation as marked by RPE65 immunostaining. Quantification of relative RPE65 fluorescence intensity with unpaired t test, ****, P < 0.0001, scale bar, 40μm. Scatterplots represent means ± s.d from three biological repeats.
(D) Zic5 knockout impairs rod photoreceptor layer differentiation as marked by Rhodopsin immunostaining. Quantification of relative rhodopsin fluorescence intensity with unpaired t test, ****, P < 0.0001, scale bar, 40μm. Scatterplots represent means ± s.d from three biological repeats.
