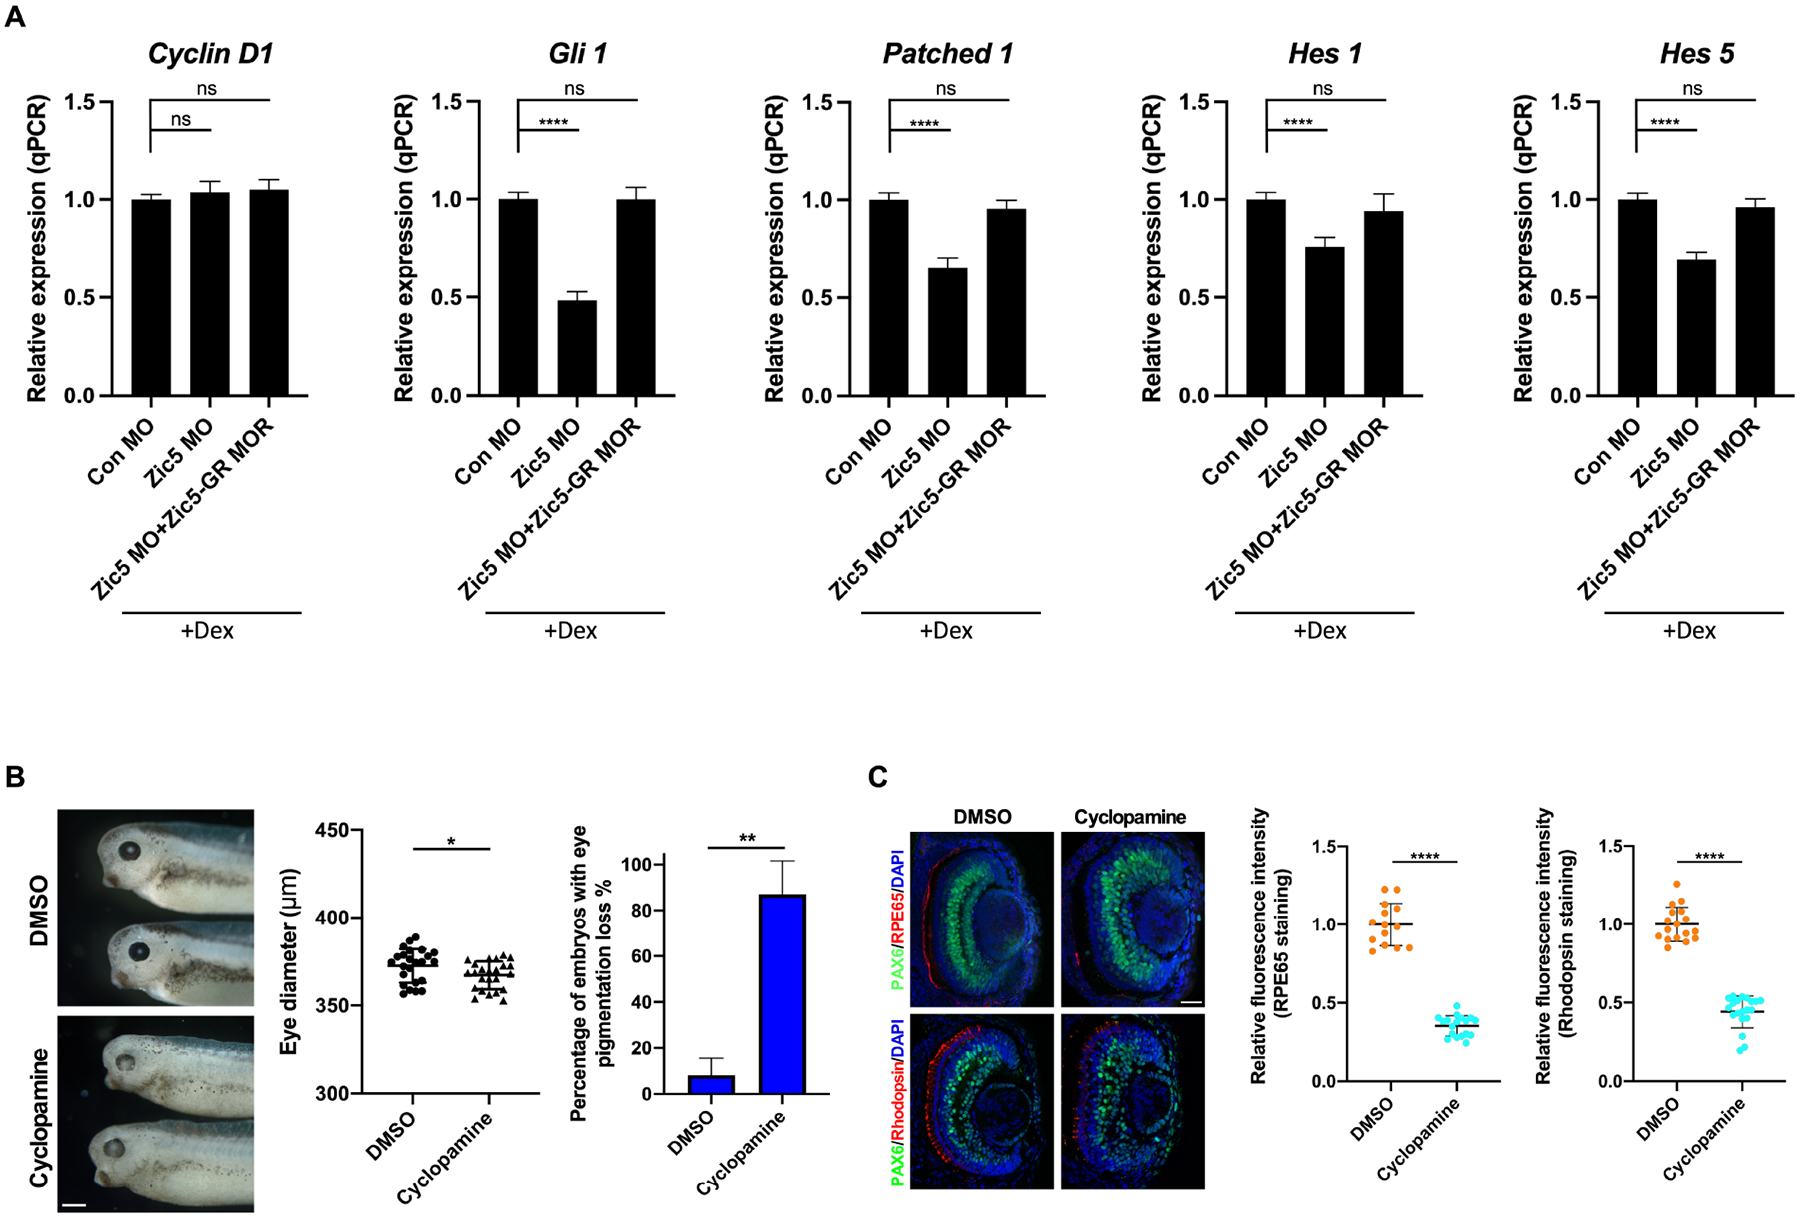
Figure 3. Zic5 regulates Hh signaling in the developing eyes.

(A) Quantitative PCR analysis of indicated genes expression using dissected eyes at stage 38. Quantification of normalized fold expression of indicated genes with one-way ANOVA (Dunnett’s multiple comparisons test), ****, P < 0.0001. Histograms represent means ± s.d. ns: no statistical differences between the groups.
(B) Inhibition of Hh pathway causes eye pigmentation loss. Eye diameter was quantified with unpaired t test, scale bar, 400 μm. Scatterplots represent means ± s.d from three biological repeats, *P < 0.05. Percentage of embryos with eye pigmentation loss was quantified with unpaired t test. Histograms represent means ± s.d from three biological repeats, **, P<0.01.
(C) Embryos were treated with DMSO or cyclopamine from stage 18–19 and then sectioned and immunostained with indicated antibodies at stage 39. Quantification of relative RPE65 fluorescence intensity with unpaired t test, scale bar, 40 μm. Scatterplots represent means ± s.d from three biological repeats, ****P < 0.0001. Quantification of relative rhodopsin fluorescence intensity with unpaired t test, scale bars, 40 μm. Scatterplots represent means ± s.d from three biological repeats, ****P < 0.0001.
