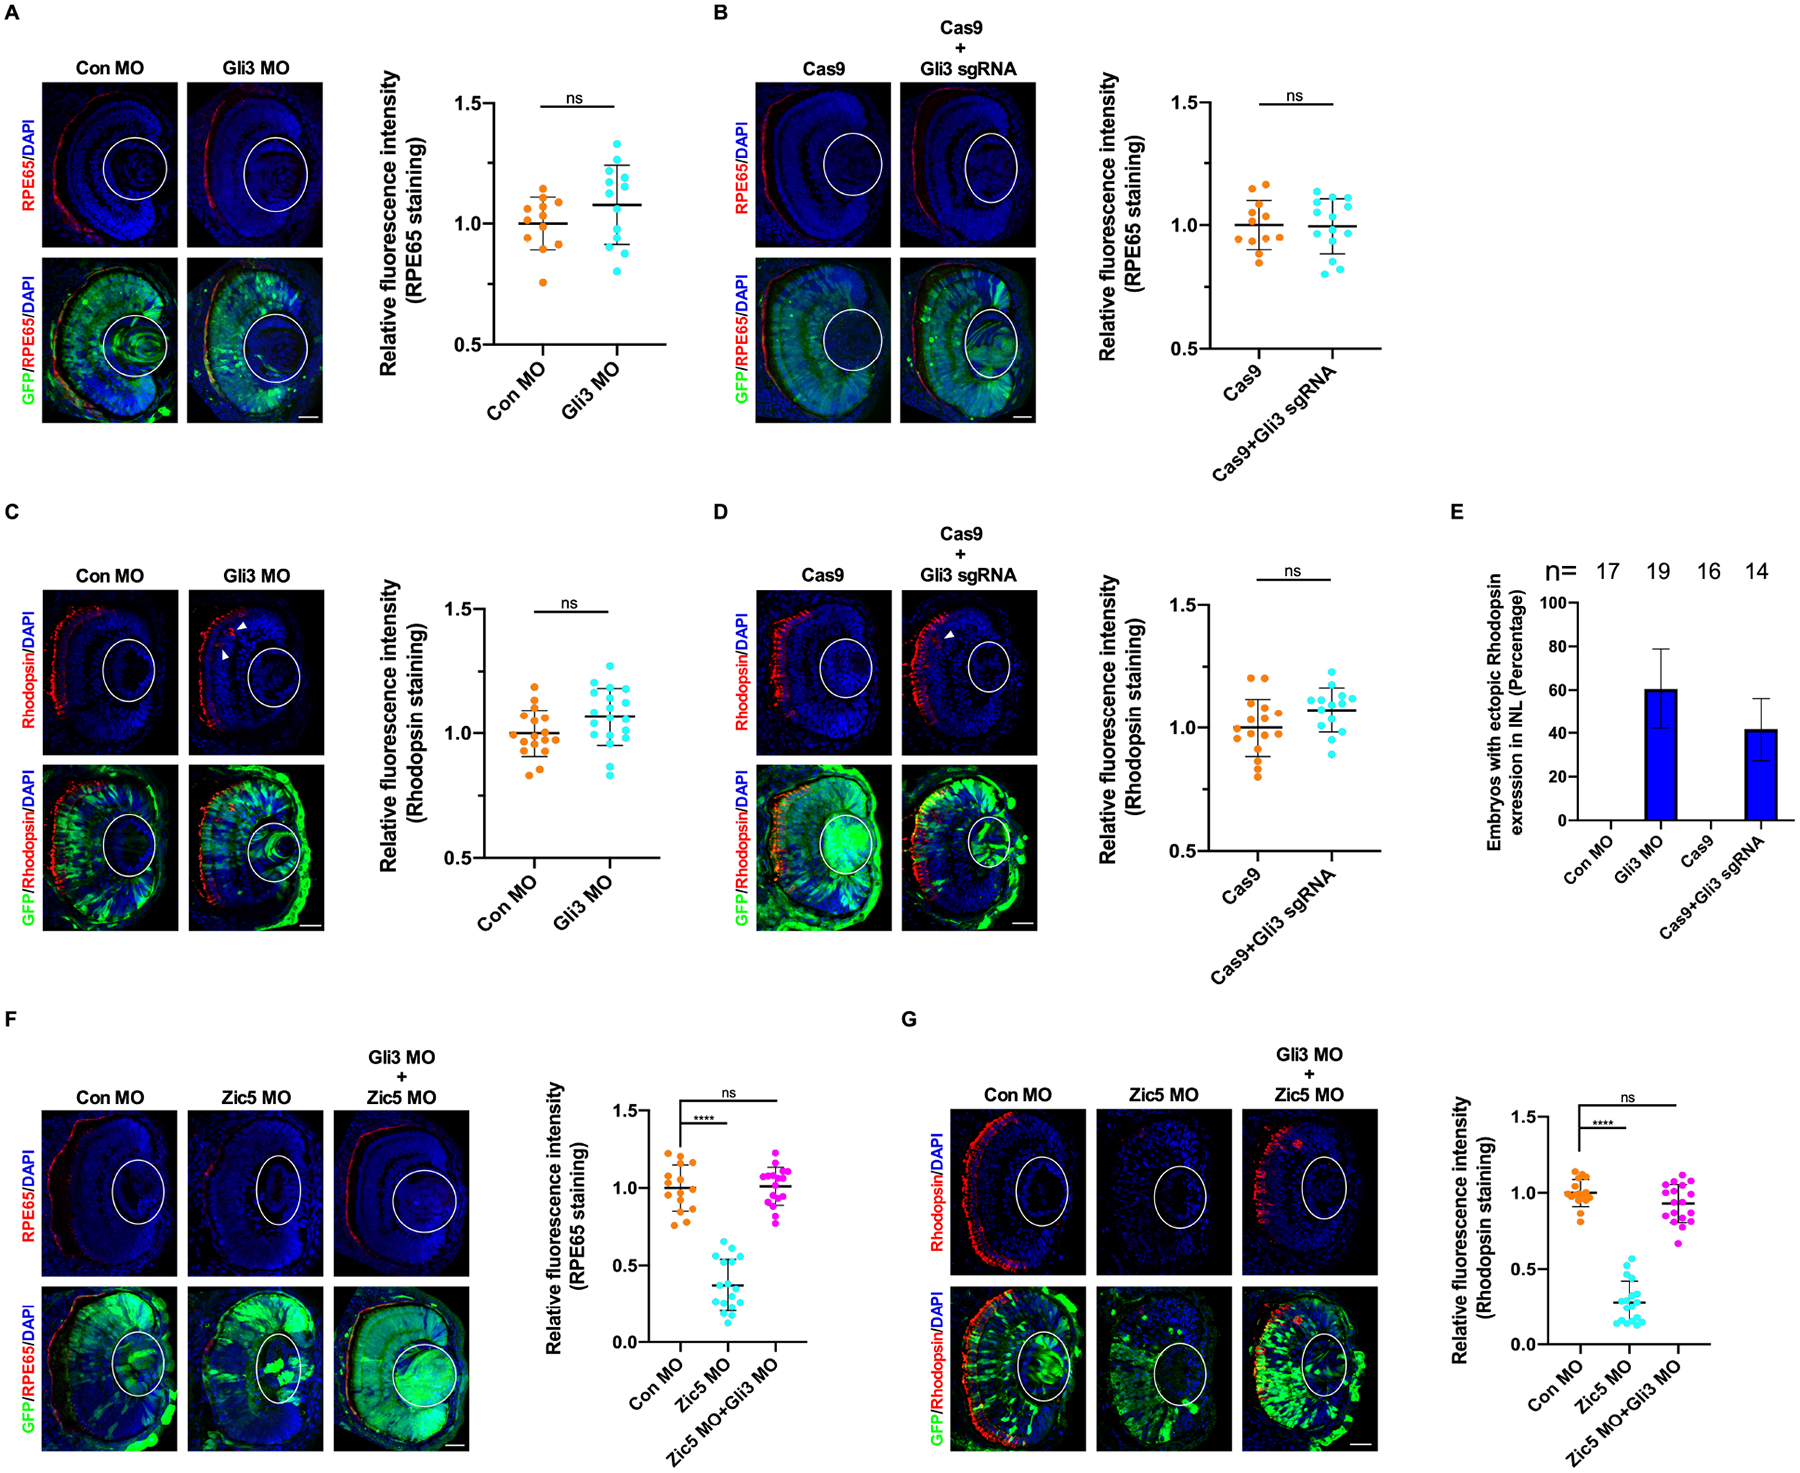
Figure 5. Zic5 regulates differentiation of RPE and rod photoreceptor layer through Gli3.

(A) Gli3 knockdown impairs RPE layer differentiation. Quantification of relative RPE65 fluorescence intensity with unpaired t test, scale bar, 40 μm. Scatterplots represent means ± s.d from three biological repeats, ns: no statistical differences between the groups.
(B) Gli3 knockout impairs RPE layer differentiation. Quantification of relative RPE65 fluorescence intensity with unpaired t test, scale bar, 40 μm. Scatterplots represent means ± s.d from three biological repeats, ns: no statistical differences between the groups.
(C) Gli3 knockdown impairs rod photoreceptor layer differentiation. Arrowhead indicates ectopic rhodopsin expression. Quantification of relative rhodopsin fluorescence intensity with unpaired t test, scale bar, 40 μm. Scatterplots represent means ± s.d from three biological repeats, ns: no statistical differences between the groups.
(D) Gli3 knockout impairs rod photoreceptor layer differentiation. Arrowhead indicates ectopic rhodopsin expression. Quantification of relative rhodopsin fluorescence intensity with unpaired t test, scale bar, 40 μm. Scatterplots represent means ± s.d from three biological repeats, ns: no statistical differences between the groups.
(E) Histograms represent the percentage of embryos from (C and D) with ectopic rhodopsin expression in the inner nuclear layer (INL) from three biological repeats.
(F) Gli3 knockdown rescues RPE layer differentiation impaired by Zic5 knockdown. Quantification of relative RPE65 fluorescence intensity with one-way ANOVA (Dunnett’s multiple comparisons test), ****P < 0.0001, scale bar, 40 μm. Scatterplots represent means ± s.d from three biological repeats.
(G) Gli3 knockdown rescues rod photoreceptor layer differentiation impaired by Zic5 knockdown. Quantification of relative rhodopsin fluorescence intensity with one-way ANOVA (Dunnett’s multiple comparisons test), ****P < 0.0001, scale bar, 40 μm. Scatterplots represent means ± s.d from three biological repeats.
