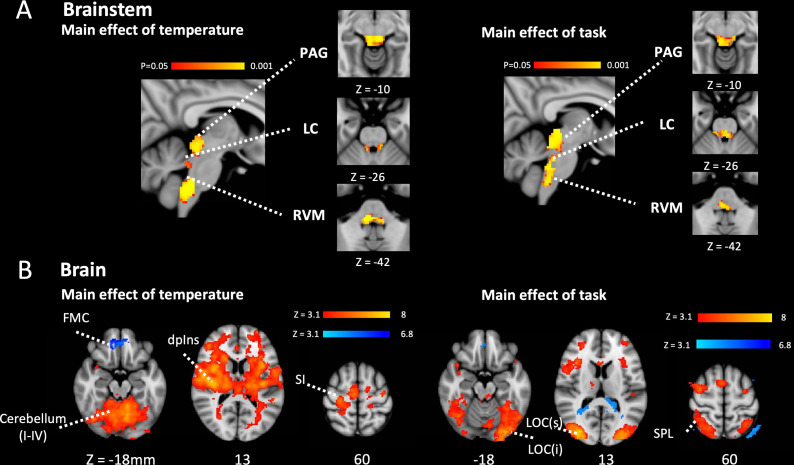
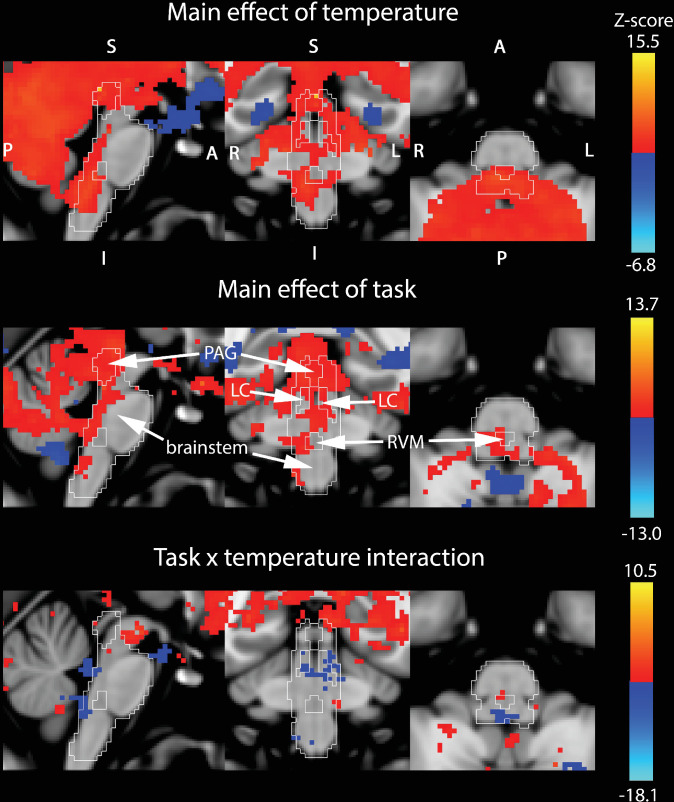
Figure 3. Main effect of task and temperature in Brainstem and Cerebrum.
(A) Main effect of temperature and task in the brainstem after permutation testing with a whole brainstem mask showing clusters of activation in PAG, bilateral LC and RVM. Activity reported with corrected p< 0.05 (TFCE). (B) Main effects of temperature and task in brain. In the main effect of temperature contrast there were clusters of activation in a number of pain related sites including in the contralateral primary somatosensory cortex, the dorsal posterior insula and the PAG (red-yellow). The frontal medial cortex de-activated (blue-light blue). In the main effect of task contrast there were clusters of activation in the visual and attention networks including superior parietal cortex, the frontal pole, and the anterior cingulate cortex (red-yellow). The posterior cingulate cortex and lateral occipital cortex showed de-activation (blue-light blue). Activity was estimated with a cluster forming threshold of Z > 3.1 and FWE corrected p < 0.05. (PAG – Periaqueductal grey, LC – Locus coeruleus, RVM – Rostral ventromedial medulla, FMC – Frontomedial cortex, dpIns – dorsal posterior insula, SI – primary somatosensory cortex, LOC – Lateral ocipital cortex (sup and inf), SPL Superior parietal lobule.).


