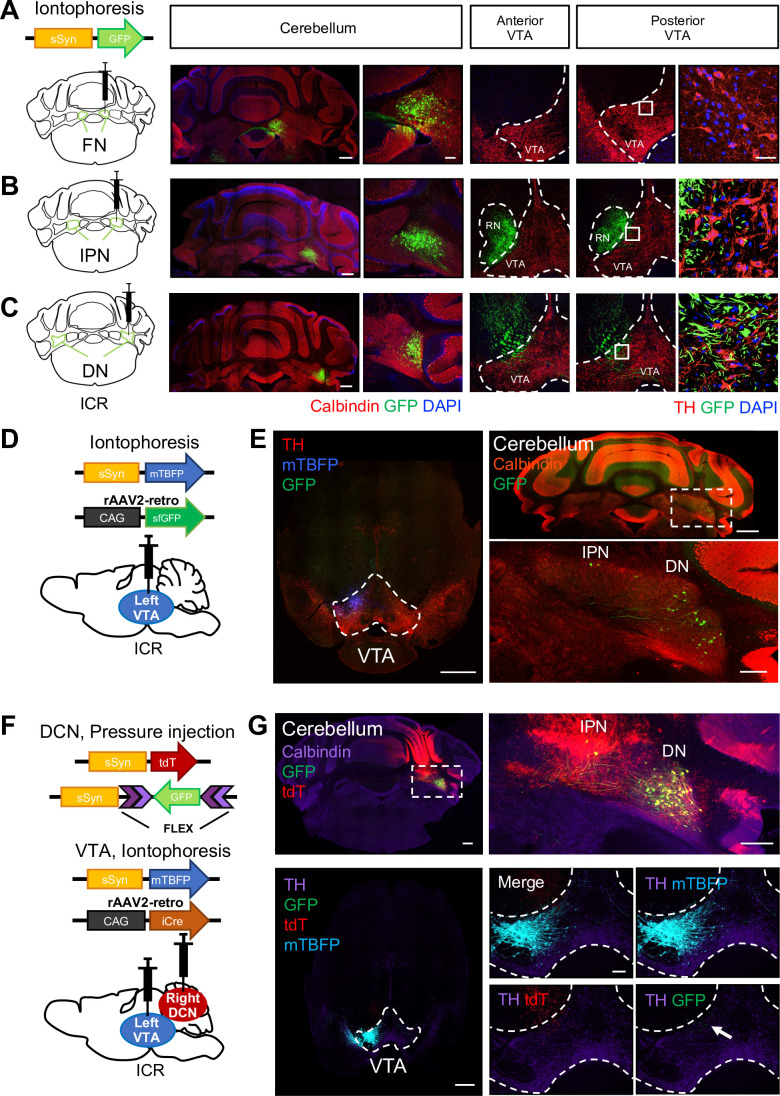
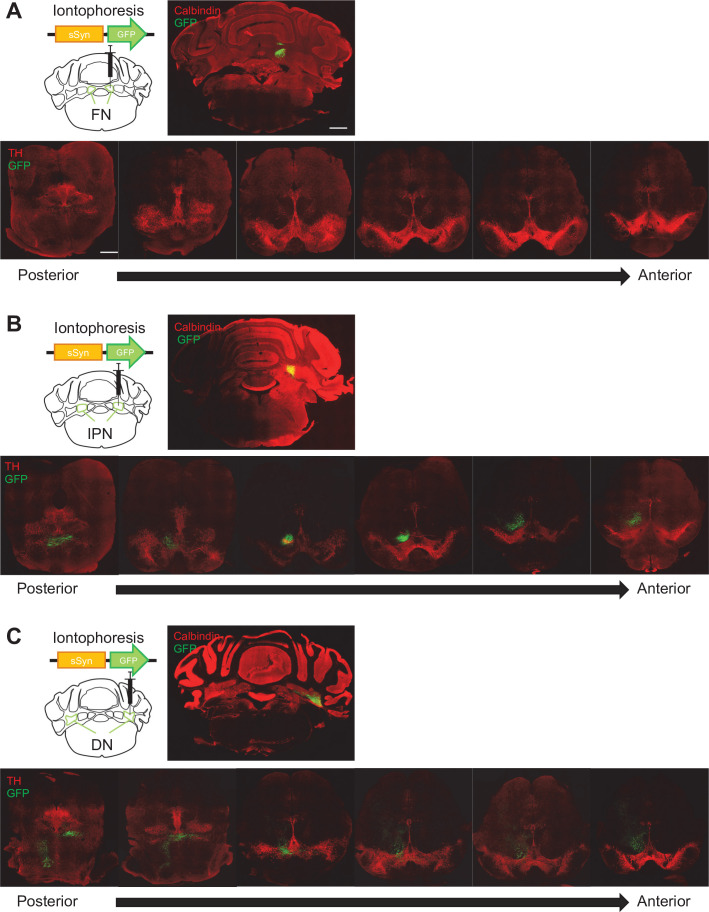
Figure 3. DCN neurons in the DN structurally project to the VTA.
(A–C) Left: schematic drawing of AAV-sSyn-GFP injection into the right side of the FN (A), the IPN (B), and the DN (C). Note that iontophoretic injection was used, to achieve confined injection of AAV in the individual nuclei. Right: confocal images showing the resulting GFP expression in cerebellar slices stained with a calbindin antibody and VTA slices stained with a tyrosine hydroxylase (TH) antibody. The rightmost panels are 3D projection views of the boxed areas. Scale bars: 500 μm (left), 50 μm (middle), and 20 μm (right). Similar image results are obtained from 7, 8, and 4 mice for fastigial, interposed and dentate nuclei respectively. (D) Schematic drawing of iontophoretic injection of rAAV2-retro-CAG-sfGFP and AAV-sSyn-mTagBFP (mTBFP) into the left side of the VTA. (E) Confocal images of a VTA-containing slice stained with a TH antibody (left) and a cerebellar slice stained with a calbindin antibody (right). Expression of GFP and mTBFP resulting from the injection shown in (D). The area within the white dotted rectangle shown in the top right panel is magnified in the bottom right panel. Scale bars: 500 μm (left and top right), and 200 μm (bottom right). For retrograde single injection, similar image results are obtained from 3 mice. (F) Schematic diagram of combined AAV injection. AAV-sSyn-tdT and AAV-sSyn-FLEX-GFP were injected into the right side of the DCN by pressure injection, whereas AAV-sSyn-mTBFP and rAAV2-retro-CAG-iCre were injected into the left side of the VTA by iontophoresis. (G) Representative confocal images of a cerebellar slice stained with a calbindin antibody (top) and a VTA-containing midbrain slice stained with a TH antibody (bottom). Expression of GFP, tdT, and mTBFP resulting from the injection shown in (F). The right panels show magnified images of the DCN (the white dotted rectangle) and VTA, including GFP-positive axons of DCN neurons (arrow). Scale bars: 500 μm (left), 250 μm (top right), and 100 μm (bottom right). For double injections, similar image results are obtained from 10 mice. White dotted rectangles shown in (E) and (G) indicate location of magnified images for DCN areas.


