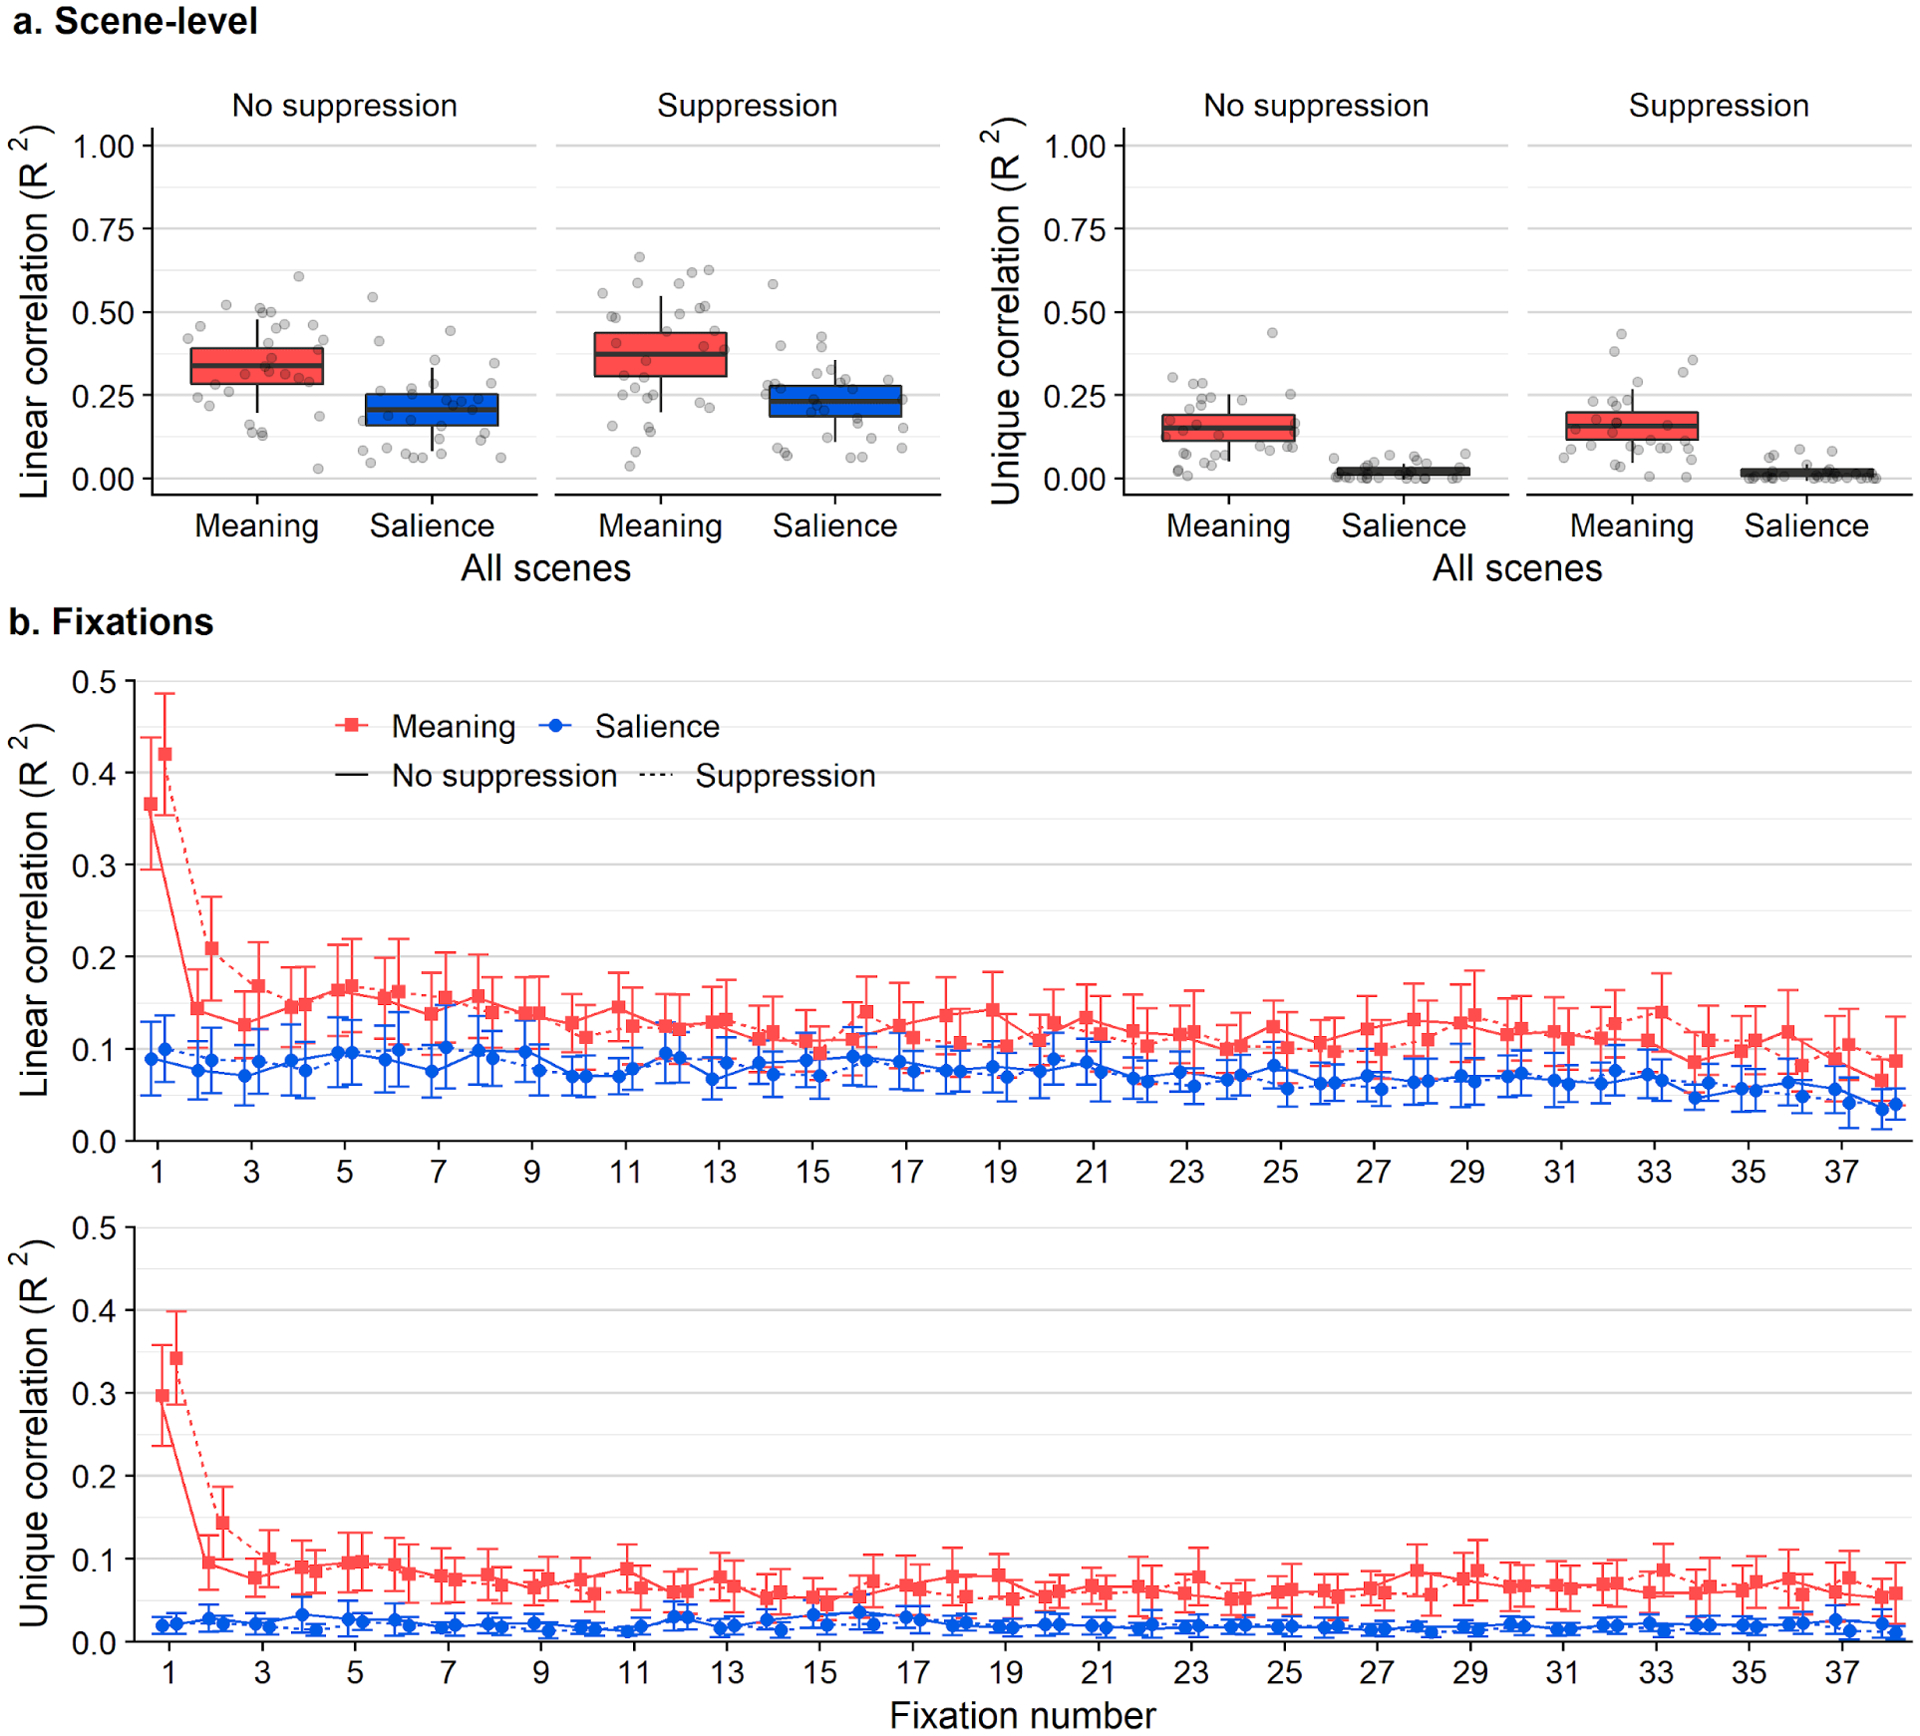
Figure 3.

a) Box plots showing linear correlations (left) and semipartial correlations (right) between feature maps (meaning, saliency) and attention maps. The scatter box plots show the corresponding grand mean (black horizontal line), 95% confidence intervals (colored box), and 1 standard deviation (black vertical line) for meaning (red box) and salience (blue box) across 30 scenes. b) Line graphs showing linear correlations (top) and semipartial correlations (bottom) between feature maps and attention maps for each fixation (1–38) when subjects engaged in a memorization task only (solid lines) or additionally an articulatory suppression task (dashed lines). Error bars indicate 95% confidence intervals.
