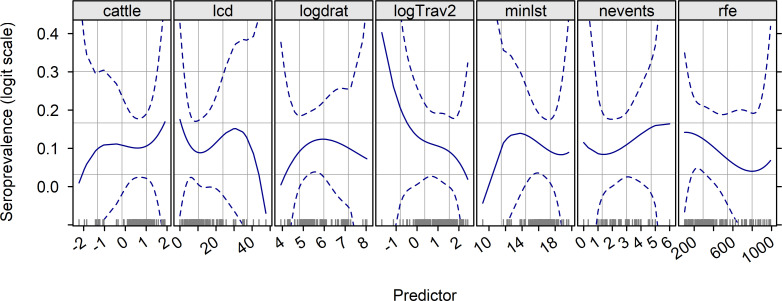
Fig 3. Logit of RVFV seroprevalence (solid line)—and 95% pointwise confidence interval (dashed lines), in small ruminants after the rainy season 2014 in Senegal, according to a spline function of its quantitative predictors.
Codes for predictors: `cattle`log of scaled cattle density at sampling locations; `lcd`least-cost distance between the sampling locations and the centroid of the nearest municipality connected with southern Mauritania via incoming ruminant trade; `logdrat`log ratio of small ruminant to cattle densities at sampling locations; `logTrav2`log of travel time needed to cross a one-km pixel at sampling locations; `minlst`minimum night land surface temperature recorded at sampling locations during the rainy season 2014; `nevents`number of dry spells at sampling locations during the rainy season 2014; `rfe`cumulative rainfall at sampling locations in 2014, in Senegal.

