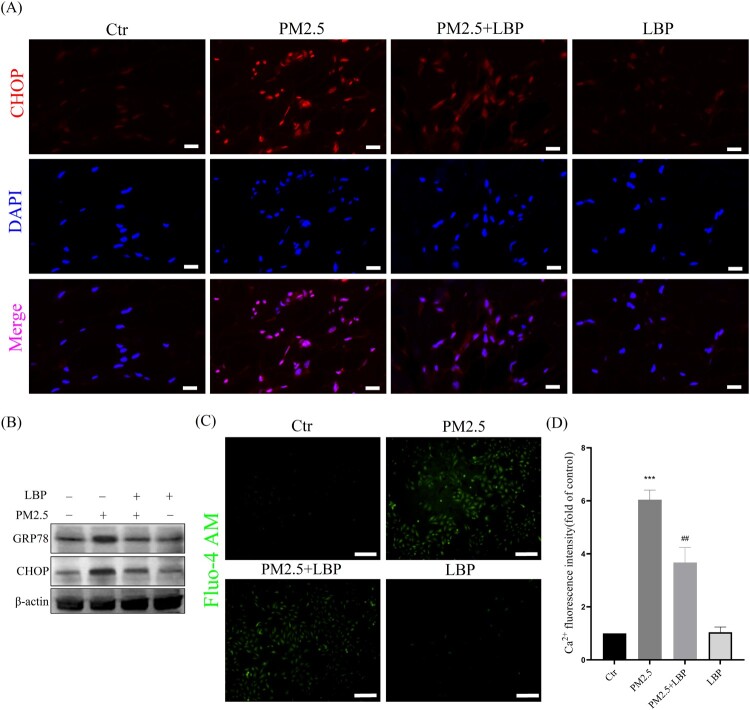
Figure 3.
LBP inhibits PM2.5-induced ER stress and CHOP expression in HaCaT cells. (A) Immunofluorescence was used to detect the expression of CHOP in HaCaT cells. Scale bar = 20 μm. (B) Western blot assay was used to detect the protein levels of GRP78 and CHOP. (C) Intracellular Ca2+ was labeled with Fluo-4 AM and analyzed by a fluorescent microscope. Scale bar = 100 μm. (D) Statistics of intracellular Ca2+ level. Values are mean ± SD. *p < 0. 05 versus the control group; # p < 0.05 versus the PM2.5 treatment alone group.

