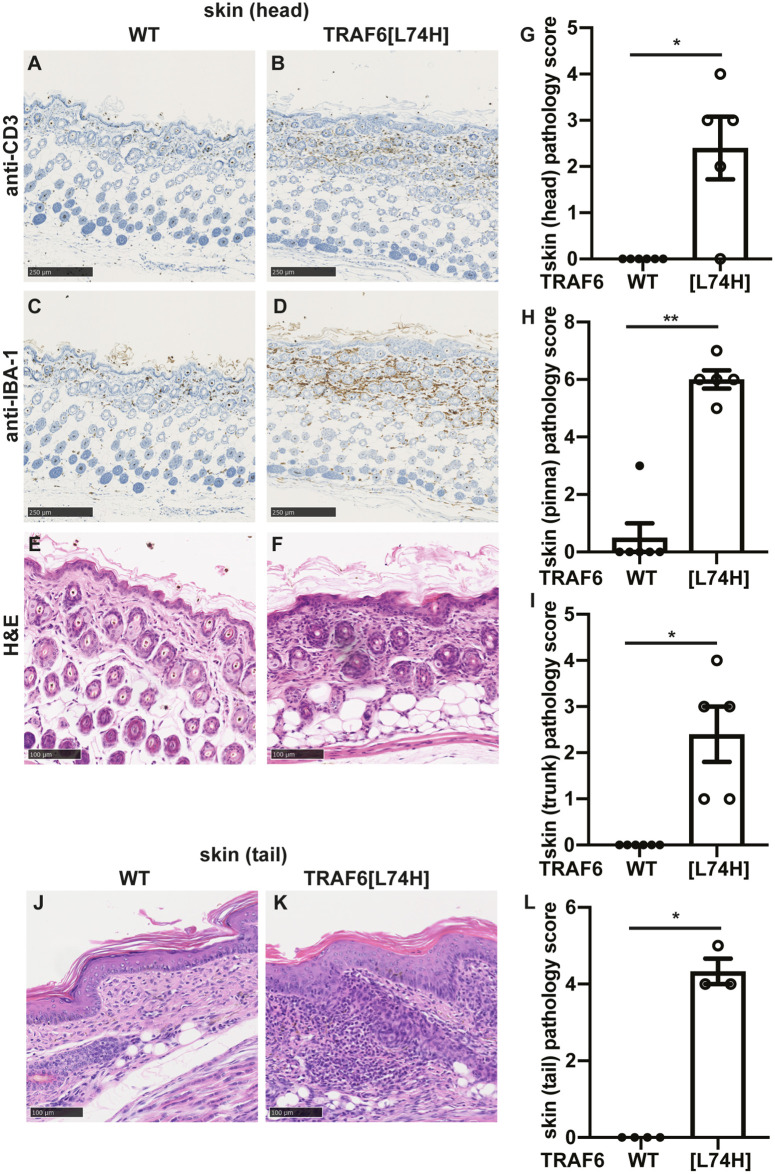
Fig 4. Severe skin inflammation seen in TRAF6[L74H] mice.
(A, B) Representative images showing skin sections from WT (A) and TRAF6[L74H] mice processed for immunohistochemistry and stained using anti-CD3 antibody. (C, D) As in A, B except that anti-IBA-1 antibody was used. (E, F) As in A, B except that skin sections from WT (A) and TRAF6[L74H] were stained with haematoxylin and eosin (H&E). (G-I) Bar graphs showing cumulative skin inflammation scores from head (G), pinna (the visible portion of the outer ear) (H) and trunk (I). (J, K) As in E, F, except the representative tail sections are shown. (L) As in G, except that the cumulative pathology score of the tail is shown. Graphs show mean ± SEM. Statistical significance between the two genotypes was calculated using the Mann-Whitney test. * denotes p<0.05 and ** denotes p<0.01. Individual values, descriptive statistics and results from the statistical analysis are provided in S4 File.

