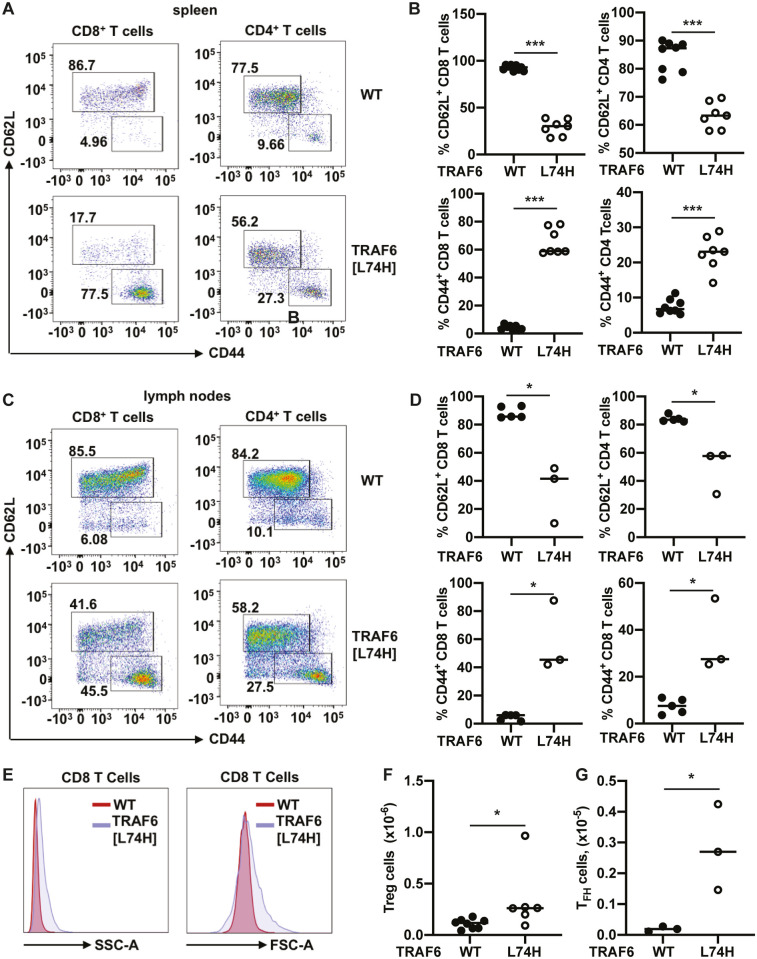
Fig 7. The T cells from TRAF6[L74H] knock-in mice display activated phenotype.
(A) Representative flow cytometry plots showing expression of CD62L and CD44 within the CD8 (DAPI-TCRβ+CD8+ population) and CD4 (DAPI-TCRβ+CD4+ population) T cells in the spleens of WT (n = 8) and TRAF6[L74H] (n = 7). (B) Graphs showing percentages of CD62L+ CD8 T cells (top left-hand panel), CD62L+ CD4 T cells (top right-hand panel), CD44+ CD8 T cells (bottom left-hand panel) and CD44+ CD8 T cells (bottom right-hand panel). (C, D) As in A and B, except plots show data from lymph nodes of 5 WT and 3 TRAF6[L74H] mice. (E) Representative histograms showing side scatter-area (SSC-A) and forward scatter area (FSC-A) of CD8 T cells (DAPI-TCRβ+CD8+ population) of WT and TRAF6[L74H] mice. (F, G) Total numbers of Treg (F) and TFH cells (G). Symbols represent individual biological replicates. (B, D, G, F) Statistical significance between the two genotypes was calculated using the unpaired t-test with Welch’s (F) correction or the Mann-Whitney test (B, D and G). * denotes p<0.05, *** denotes p<0.001 and n.s. denotes not significant difference. Individual values, descriptive statistics and results from the statistical analysis are provided in S7 File.

