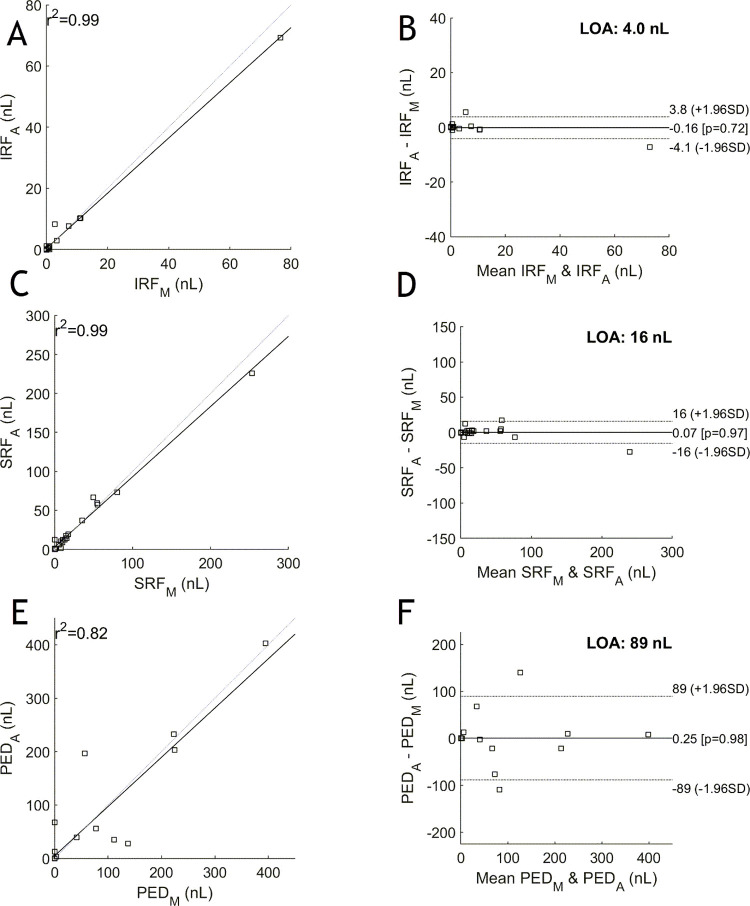
Fig 2.
The manual versus automated reported total areas for each fluid type across all volumes on the left for IRF (A), SRF (C) and PED (E); and their corresponding Bland-Altman plots on the right for IRF (B), SRF (D) and PED (F). The correlation scores are 0.992, 0.986 and 0.820 for IRF, SRF and PED, respectively. For the Bland-Altman plots, the manual values are denoted with subscript ‘M’ and the automated values with ‘A’. Narrow limits of agreement are shown for IRF and SRF, but are larger for PED, as is addressed in the discussion.

