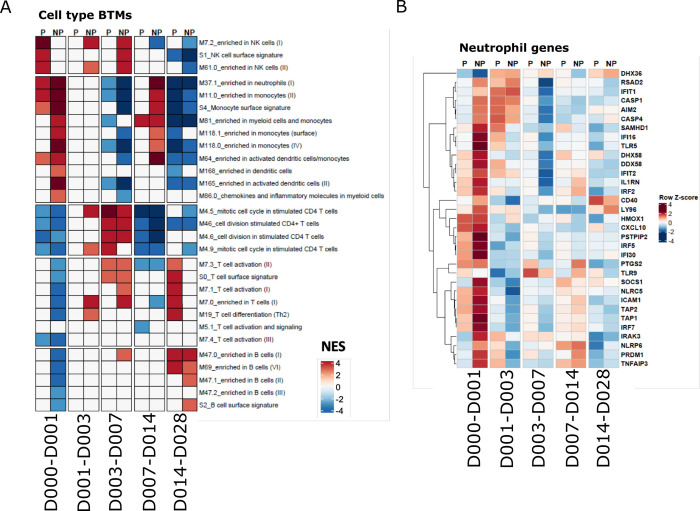
Fig 4. Cell type-associated responses after the first vaccination.
A. Heatmap showing cell type specific BTM GSEA NESs in P and NP subjects. B. Heatmap showing expression changes of malaria responding neutrophil genes in P and NP subjects on the sampling day compared with the previous sampling day. Expression values were z-score transformed by row for visualization.

