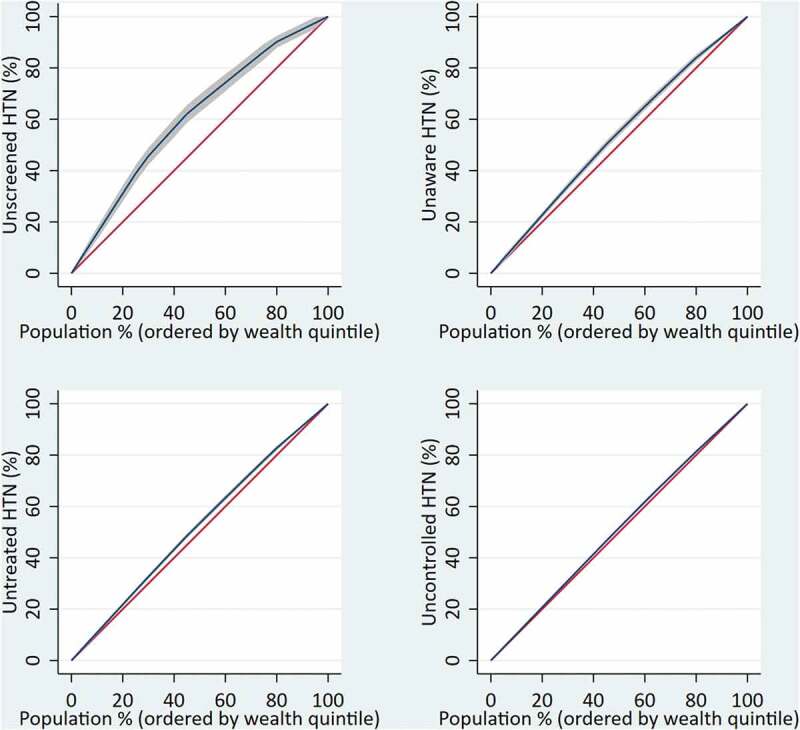
Figure 3.

Economic inequalities in the cascade of hypertension care.
Note: y-axis is the cumulative percentage of the outcome variables, x-axis is the cumulative percentage of population ordered by the wealth quintile from the lowest to the higher quintile; HTN = hypertension. The concentration index (cin) is defined as twice the area between the concentration curve (blue) and the line of equality (the 45-degree red line). A positive cin (curve below the line of equality) indicates that ill/undesired health is more prevalent among the rich, and a negative one (curve above the line of equality) indicates that the outcome is more prevalent among the poor.
