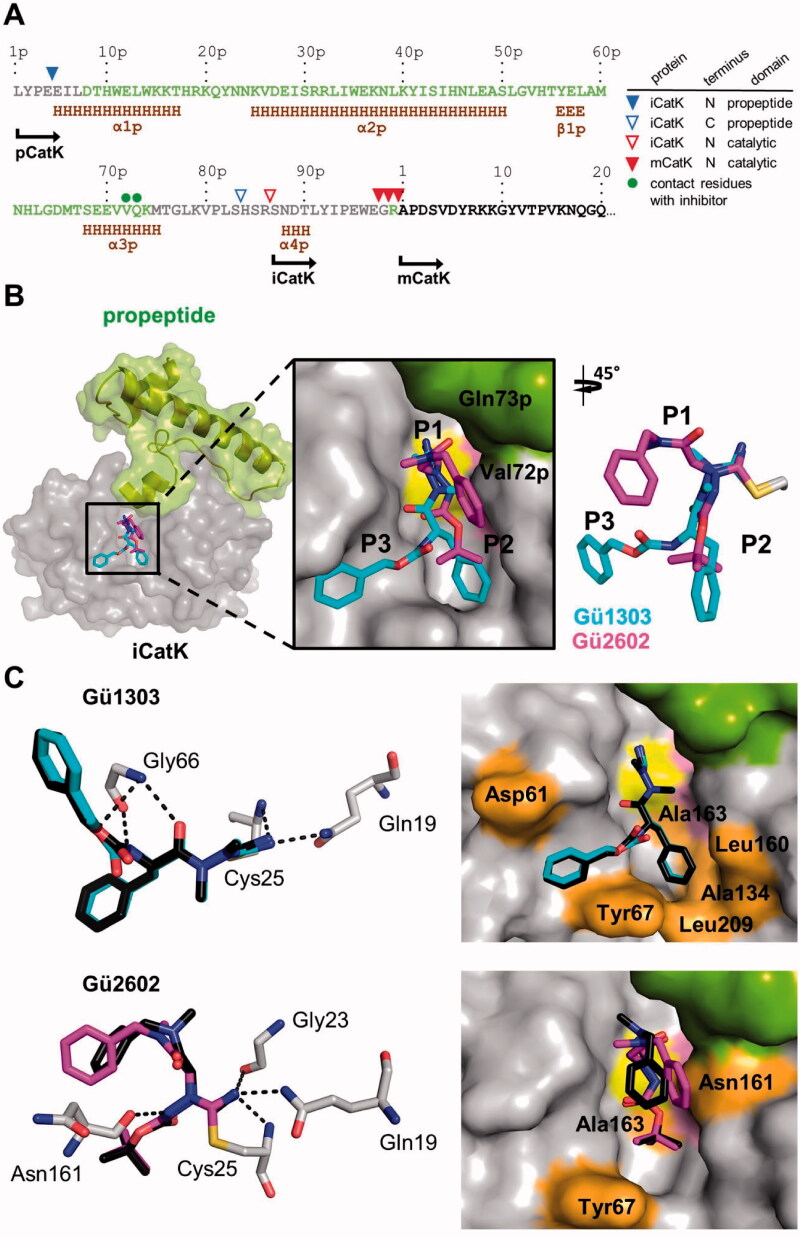
Figure 5.
Binding mode of the cyanohydrazide inhibitors Gü1303 and Gü2602 in the active site of the activation intermediate of cathepsin K (iCatK). (A) The amino acid sequence of the full-length propeptide domain and the N-terminus of mature CatK (mCatK) are shown with secondary structure elements (H, α-helix; E, β-strand) (data absent in the iCatK structure are derived from the intact zymogen pCatK; PDB entry: 1BY8). Propeptide residues present or absent in the final crystallographic models of iCatK are in green or grey, respectively, residues of the catalytic domain are in black. The triangles above the sequence line indicate the N- and C-termini of the residual propeptid domain of iCatK, the N-termini of iCatK and mCatK catalytic domains as determined by the Edman sequencing and mass spectrometry (see the inset legend). The green dots show two residues of the propeptid of iCatK that form contacts with Gü2602. The position of the N-termini is indicated for pCatK and catalytic domains of iCatK/mCatK. (B) The zoomed-in view of the iCatK active site shows a superposition of Gü1303 and Gü2602 bound to the S1 to S3 subsites (corresponding inhibitor positions P1 to P3 are indicated). iCatK is displayed in surface representation, the catalytic domain is highlighted in grey, the residual propeptide domain in green, and the catalytic residues Cys25 and His162 in yellow and pink, respectively. Inhibitors are shown in stick representation with carbon atoms in cyan for Gü1303 and magenta for Gü2602; heteroatoms have a standard colour coding (O, red; N, blue; S, yellow). (C) Interaction of the inhibitors with the iCatK active site residues. Left panels: the hydrogen bond network formed between inhibitors and iCatK residues with the (dashed black lines). Inhibitors are coloured as in (B), and interacting enzyme residues are in grey; the side chain of the covalently linked catalytic cysteine residue Cys25 is depicted. Superimposed (black) are the same inhibitors from the structures of their complexes with mCatK (Figure 4). Right panels: the surface representation of the iCatK active site shows enzyme residues forming nonpolar interactions (highlighted in orange) with the inhibitors (in stick representation); both inhibitors are in the same orientation. The propeptide domain residues are highlighted in green.

