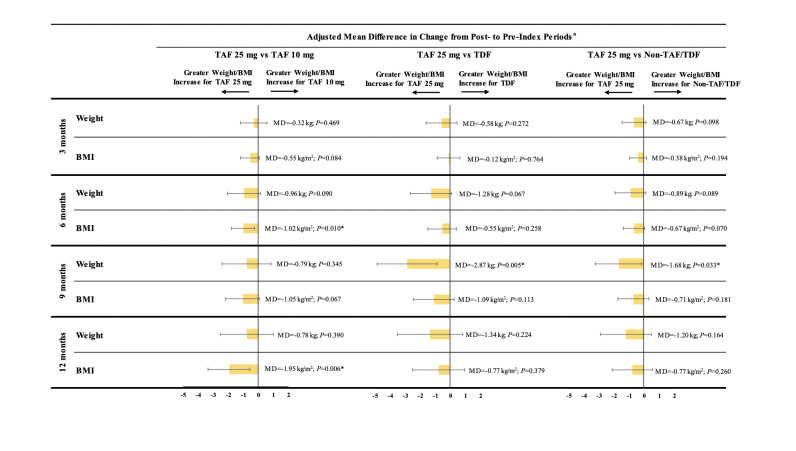
Figure 2. Comparison of Mean Weight or BMI Change Between Pre-index and Post-index Periods.
* P value significant at 5% level.
Abbreviations: BMI, body mass index; CI, confidence interval; MD, mean difference; TAF, tenofovir alafenamide; TDF, tenofovir disoproxil fumarate.
a Mean differences and their associated 95% CIs and P values were estimated using ordinary least squares regression models adjusted for the following baseline characteristics: age, gender, race, insurance plan type, US geographic region, year of the index date, number of mental health–related comorbidities, symptomatic HIV/AIDS, Quan-Charlson Comorbidity Index score, hypertension, type 2 diabetes, prediabetes, baseline BMI, use of an INSTI agent in the index regimen, and use of a medication associated with weight change. A mean difference <0 indicates that the TAF 10 mg, TDF, or non-TAF/TDF cohorts had a lower mean weight gain or BMI increase than the TAF 25 mg cohort.

