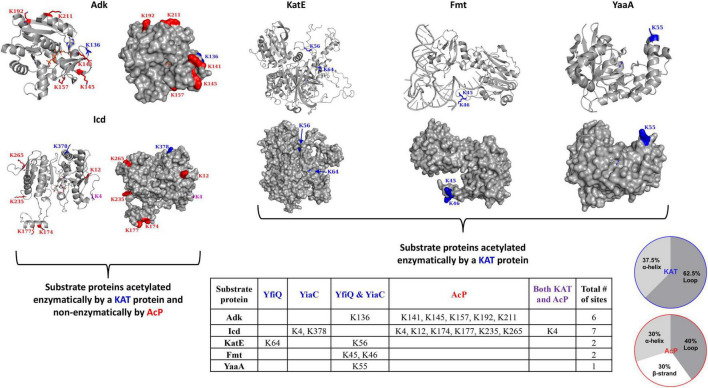
FIGURE 2.
Escherichia coli K-12 lysine acetyltransferase (KAT) and acetyl phosphate (AcP) acetylation sites on substrate proteins Adk, Icd, KatE, Fmt, and YaaA. The table details sites of acetylation that occur via KATs (blue) YfiQ, YiaC, or both YfiQ and YiaC, AcP (red), or both KATs and AcP (purple). The crystal structures of the substrate proteins are in gray ribbons and the lysine residues that were previously identified as acetylated in E. coli K-12 are shown with sticks and colored by type of acetylation. AcP acetylation sites are in red, KAT acetylation sites are in blue, and both AcP and KAT acetylation sites are in purple. Monomers from the crystal structures are the same as those described in Figure 1 and Adk is shown in the closed conformation. The pie charts show the percentage of KAT and AcP sites on Adk, Icd, Fmt, KatE, and YaaA E. coli proteins that are located on alpha helices, beta strands, or loops.

