Figure 5.
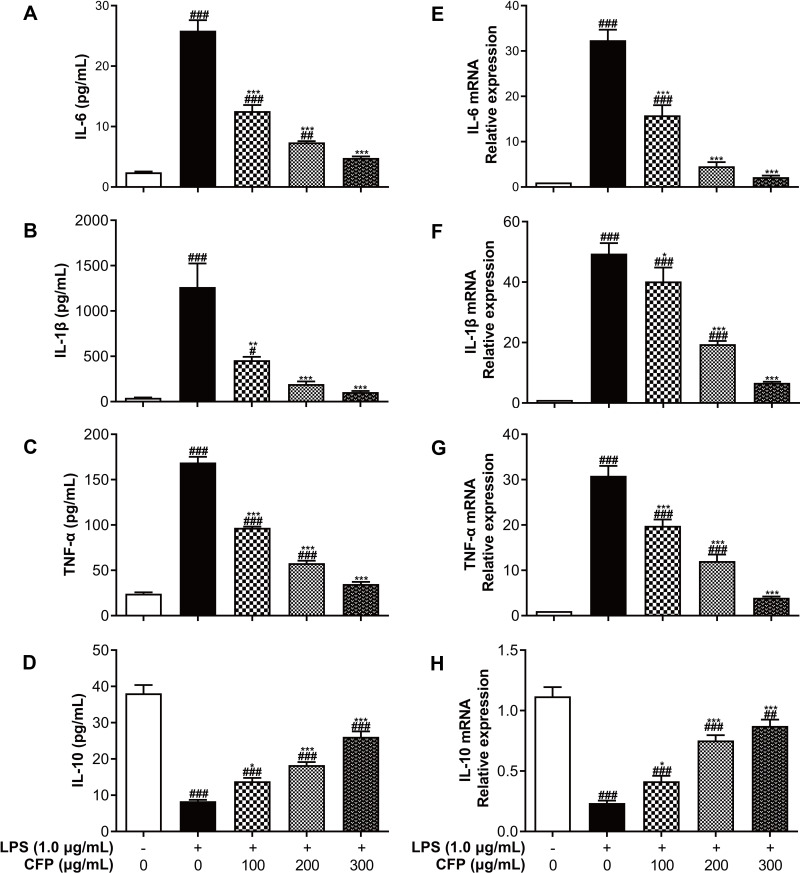
Effects of CFP on the production and gene expression of inflammatory cytokines. After LPS stimulation, the contents of IL-6 (A), IL-1β (B), TNF-α (C) and IL-10 (D) were performed using ELISA, and mRNA levels of IL-6 (E), IL-1β (F), TNF-α (G) and IL-10 (H) were measured by RT-PCR. Data represent the average of the three replicates. #P < 0.05, ##P < 0.01 and ###P < 0.001 vs control group; *P < 0.05, **P < 0.01 and ***P < 0.001 vs LPS group.

