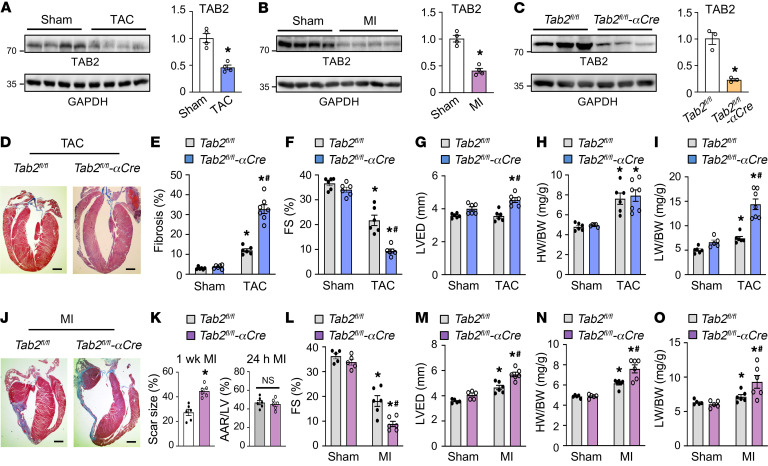
Figure 3. TAB2-deficient mice are predisposed to adverse cardiac remodeling and dysfunction after pathological stress.
(A and B) Western blot and quantification of cardiac TAB2 levels normalized to GAPDH in WT mice subjected to TAC versus sham (A) or MI versus sham (B) for 2 weeks. *P < 0.05 versus sham. n = 4. (C) Western blot and quantification of cardiac TAB2 levels in Tab2fl/fl and Tab2fl/fl-αMHC-Cre mice at 2 months of age. *P < 0.05 versus Tab2fl/fl. n = 3. (D) Masson’s trichrome–stained cardiac sections from mice of the indicated genotypes 1 week after TAC. (E) Quantification of cardiac fibrosis. *P < 0.05 versus sham. #P < 0.05 versus Tab2fl/fl TAC. n = 6–7. (F and G) Echocardiographic measurement of FS and LVED. *P < 0.05 versus sham. #P < 0.05 versus Tab2fl/fl TAC. (H) HW/BW ratio of the indicated mice. *P < 0.05 versus sham. (I) LW/BW ratio of the indicated mice. *P < 0.05 versus sham. #P< 0.05 versus Tab2fl/fl TAC. (J) Masson’s trichrome–stained cardiac sections from the indicated mice 1 week after MI. (K) Infarct scar size of the indicated mice subjected to MI for 1 week (left). Initial area at risk (AAR) normalized to area of the left ventricle (LV) was measured 24 hours after MI. *P < 0.05 versus Tab2fl/fl. n = 6. (L and M) FS and LVED measured by echocardiography. *P < 0.05 versus sham. #P < 0.05 versus Tab2fl/fl MI. n = 5–6. (N and O) HW/BW and LW/BW ratios. *P < 0.05 versus sham. #P < 0.05 versus Tab2fl/fl MI. n = 5–6. Data were analyzed by Student’s t test for comparisons between 2 groups and by 2-way ANOVA with Tukey’s multiple-comparison test for consideration of genotypes and treatments.

