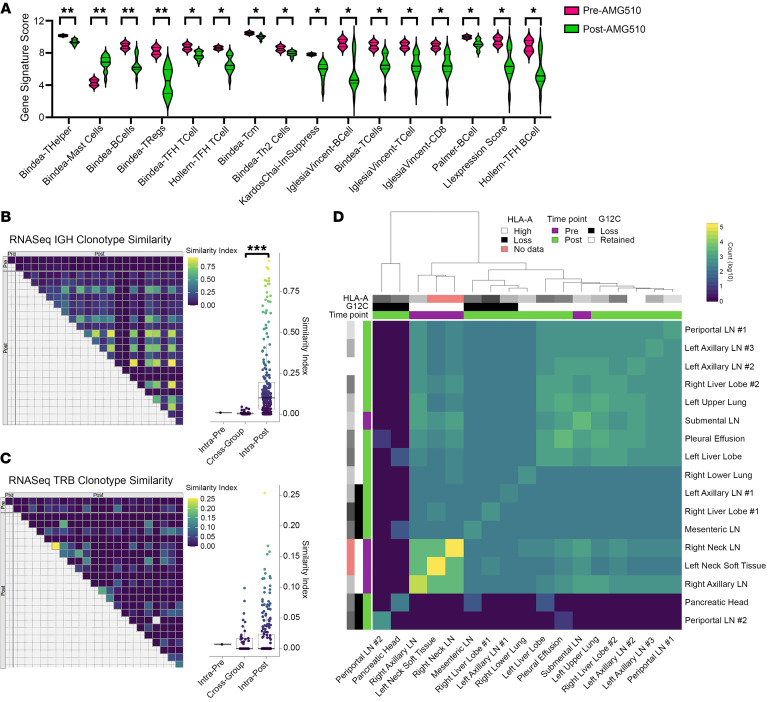
Figure 4. Tumor immunogenomic and neoantigen features.
(A) Immune gene signatures by treatment time point, out of 40 tested signatures. (B) Tumor sample IgH repertoire comparison, by treatment time point. Horn’s modified Morisita overlap index. (C) Tumor sample T cell receptor β chain (TRB) repertoire comparison, by treatment time point. Horn’s modified Morisita overlap index. (D) Intersample predicted neoantigen count overlap between samples, log10 scale. Significance was assessed with the 2-sided Student’s t test. *P < 0.05, **P < 0.01, ***P < 0.001.

