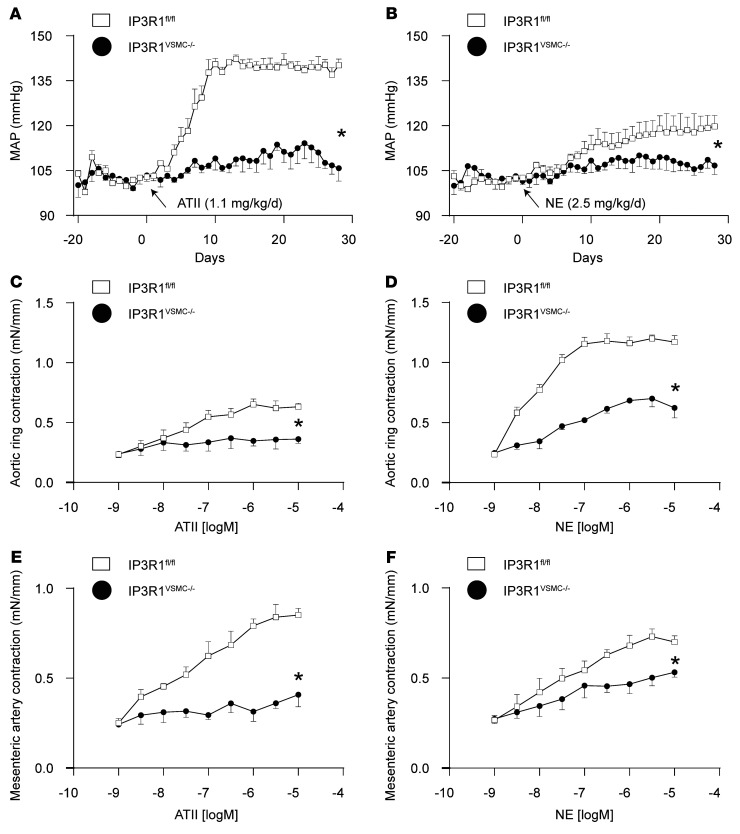
Figure 2. Global evaluation of vascular responses in IP3R1VSMC–/– mice.
(A and B) MAP was measured by radiotelemetry in IP3R1fl/fl and IP3R1VSMC–/– mice at baseline (days –20 to 0) and following administration of ATII (A) or NE (B) via miniosmotic pumps. n ≥6 mice/group. *P < 0.05 versus IP3R1fl/fl mice, by repeated-measures ANOVA. (C–F) Vascular reactivity of aortic segments (C and D) and third-order mesenteric arteries (E and F) in response to ATII (C and E) and NE (D and F). Data are presented as the mean ± SEM. mN, millinewton. n = 8–20 rings from at least 6 mice per group. *P < 0.05 versus IP3R1fl/fl mice, by repeated-measures ANOVA.

