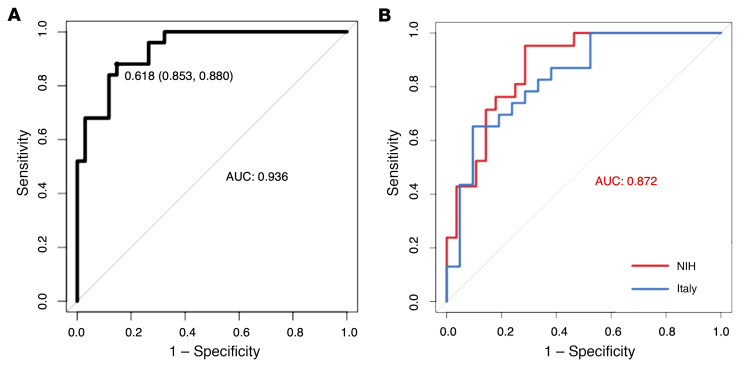
Figure 8. Logistic regression provided a serum biomarker composed of 6 metabolites: BHB, acetoacetate, valine, creatine, betaine, and pyruvate.
(A) ROC curve with serum samples of prodromal-like (n = 25) and sham-operated (n = 34) animal models (6-OHDA and α-synuclein rats) (AUC = 0.936; sensitivity: 0.853; specificity: 0.88). (B) ROC curve with data of PD patients and matched controls of NIH cohort in red (n = 19 and n = 30; AUC = 0.88; sensitivity: 0.957; specificity: 0.714) and first Italian cohort in blue (n = 23 and n = 21; AUC = 0.83; sensitivity: 0.65, specificity: 0.90).

