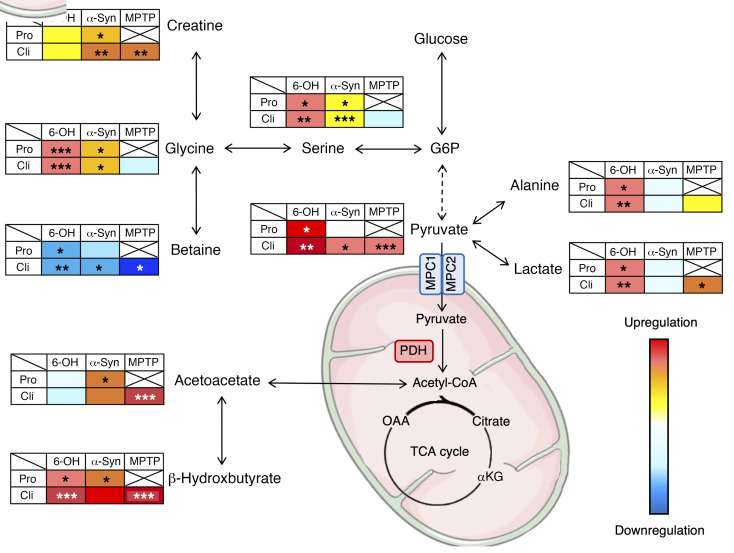
Figure 9. Schematic representation of altered metabolic pathways in different PD animal models mimicking different stages of the disease, suggesting possible reprogramming of pyruvate metabolic pathway.
Degrees of dysregulation were represented by color gradation compared with sham-operated animals in each model. *P < 0.05; **P < 0.01; ***P < 0.001. Pro, prodromal-like; Cli, clinical-like; G6P, glucose-6-phosphate; OAA, oxaloacetate; αKG: α- ketoglutarate; α-syn, α-synuclein.

