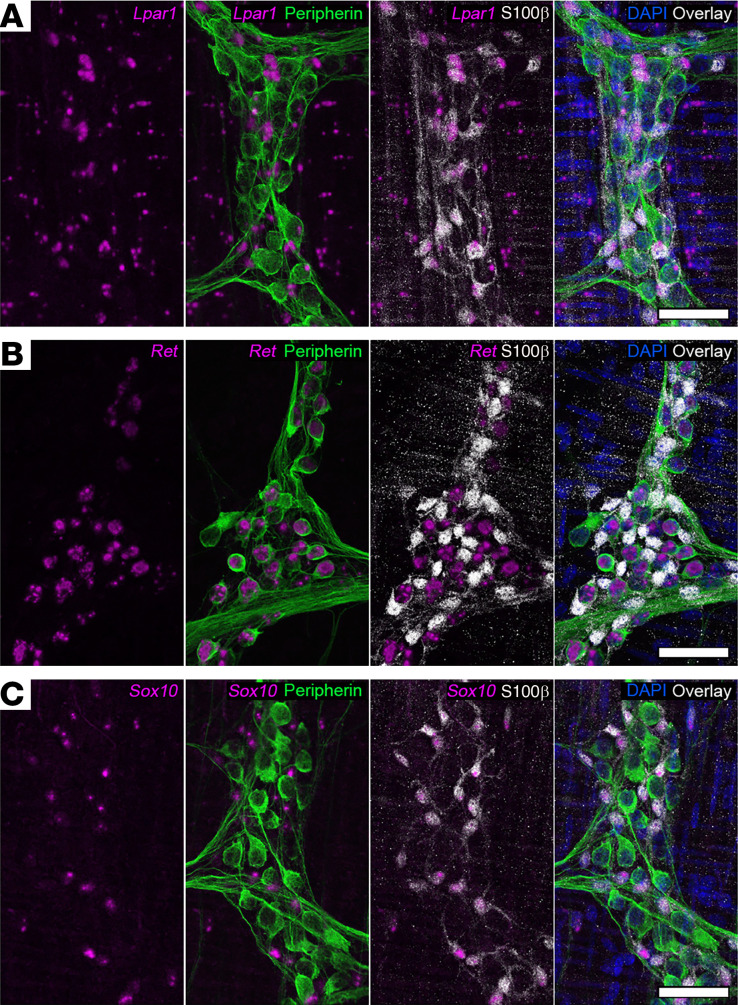
Figure 2. Distribution of Lpar1 mRNA in the mouse colon myenteric plexus.
(A) Combined in situ hybridization (RNAscope) and immunofluorescence showing Lpar1 mRNA (magenta) expression in combination with markers of neurons (peripherin, green) and glia (S100β, gray). Lpar1 is primarily expressed by S100β-positive glia in the myenteric plexus. (B and C) Validation of RNAscope protocol sensitivity and specificity in the murine ENS. RNAscope probes for Ret (B, leftmost panel, magenta) and Sox10 (C, leftmost panel, magenta) demonstrate neuronal (peripherin, green) and glial (S100β, gray) specificity, respectively. Images are representative of labeling in n = 3 animals. Scale bars in A–C = 50 μm.

