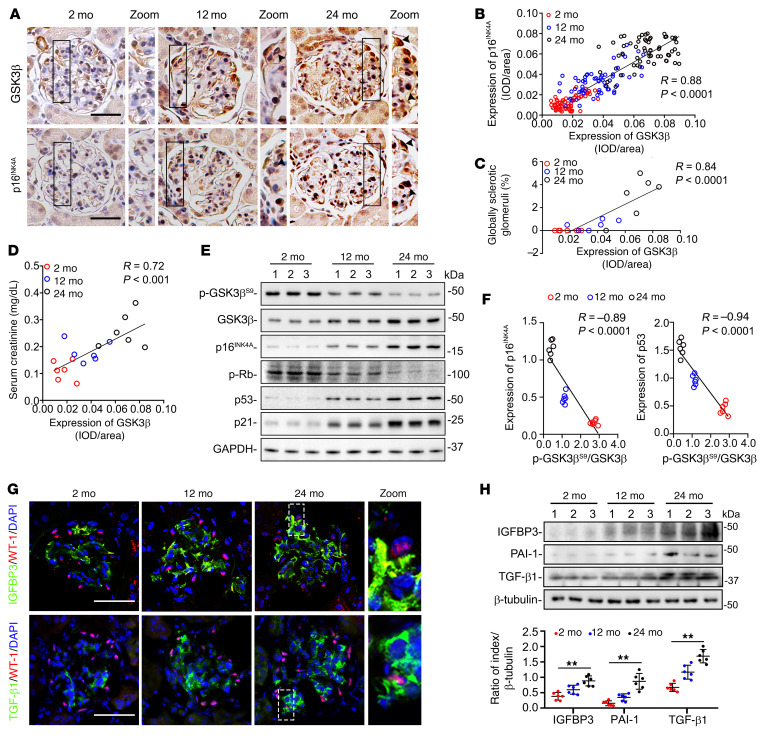
Figure 2. GSK3β is overexpressed and hyperactive in glomerular podocytes during the aging process in mice, and is associated with podocyte senescence, senescence-associated secretory phenotypes (SASPs), and kidney aging.
(A) Mice were treated as elaborated in Supplemental Figure 2. Consecutive kidney sections collected at 2, 12, or 24 months of age (mo) were subjected to peroxidase immunohistochemical staining. Zoomed-in views of boxed areas show positive podocyte staining, as indicated by arrowheads. Scale bars: 20 μm and 4 μm (zoomed-in images). (B) Linear regression analysis reveals a significant correlation between the relative glomerular staining intensity of GSK3β and that of p16INK4A, as estimated by computerized morphometric analysis (n = 6 mice, 60 glomeruli were analyzed per group with 10 per mouse). IOD, integrated optical density. (C and D) Linear regression analysis reveals significant correlations between the average relative glomerular staining intensity of GSK3β and (C) the percentage of global glomerulosclerosis or (D) serum creatinine levels (n = 6). (E) Representative immunoblot analysis of isolated glomeruli for indicated proteins. GAPDH served as a loading control. (F) Linear regression analysis showed an inverse correlation between the relative p-GSK3βS9/GSK3β ratios and the relative expression levels of p16INK4A or p53 in glomeruli based on densitometric analysis of immunoblots (n = 6). (G) Kidney tissues were subjected to fluorescent immunohistochemical staining. Zoomed-in views of boxed areas show positive staining for SASP factors in WT-1+ podocytes. Scale bars: 30 μm (left 3 columns) and 3 μm (zoomed-in images). (H) Representative immunoblot of isolated glomeruli analyzed for SASP factors. Densitometric analyses of the expression levels of diverse SASP factors in glomeruli, presented as relative levels normalized to β-tubulin based on immunoblot analysis. **P < 0.01 among different age groups (n = 6). Data are expressed as mean ± SD. Spearman’s correlation coefficient (R) and P value are shown in panels B–D and F. Panel H was analyzed by 1-way ANOVA.

