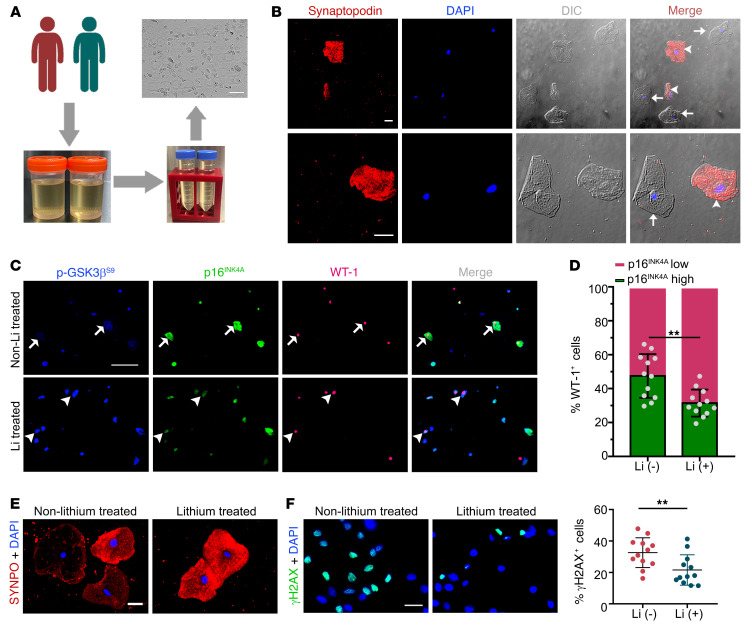
Figure 8. Long-term lithium carbonate therapy in psychiatric patients inhibits GSK3β activity and attenuates cellular senescence in urinary exfoliated cells.
(A) Schematic diagram depicts preparation of urinary exfoliated cells from psychiatric patients treated either with lithium carbonate [Li (+), n = 12] or without lithium carbonate [Li (–), n = 12]. Scale bars: 100 μm. (B) Immunofluorescent staining of urinary exfoliated cells for synaptopodin (red) with DAPI counterstaining for nuclei, as shown by fluorescence microscopy and differential interference contrast (DIC) microscopy. Arrowheads indicate synaptopodin-positive podocytes, while arrows indicate synaptopodin-negative urinary cells. Scale bars: 20 μm. (C) Multicolor immunofluorescent staining of urinary exfoliated cells for phosphorylated GSK3β at serine 9 (p-GSK3βS9), p16INK4A, and WT-1. Arrows indicate WT-1–positive urinary podocytes with p-GSK3βS9-lop16hi staining pattern. Arrowheads indicate WT-1–positive urinary podocytes with p-GSK3βS9-hip16lo staining pattern. Scale bars: 100 μm. (D) Quantification of cells with high and low expression of p16INK4A among all WT-1+ urinary cells. **P < 0.01 (n = 12). (E) Immunofluorescent staining of urinary exfoliated cells for synaptopodin (SYNPO) followed by counterstaining with DAPI. Scale bars: 20 μm. (F) Immunofluorescent staining of urine exfoliated cells for γH2AX followed by counterstaining with DAPI. Scale bars: 20 μm. Absolute count of the number of γH2AX-positive cells as percentage of the number of urinary exfoliated cells per microscopic field. **P < 0.01 (n = 12). Data are expressed as mean ± SD. Panels D and F were analyzed by 2-tailed, unpaired Student’s t test.

